Coronavirus: Five things a Covid-19 symptom-tracking app tells us
- Published
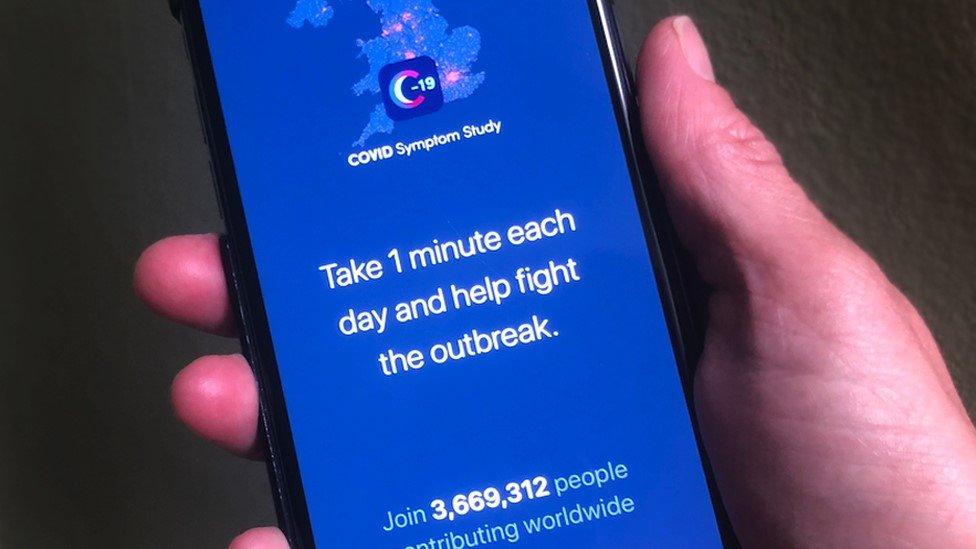
The Covid-19 Symptom Study app is thought to be the largest study of its kind
The UK's scientists have been trying to trace Covid-19's path through the population ever since the coronavirus arrived on British shores.
In what is thought to be the largest study of its kind in the world, an app developed by King's College London (KCL) and technology company Zoe, which tracks symptoms of the disease, has been downloaded more than three million times in the UK.
Not to be confused with the government's contact-tracing app, the Covid-19 Symptom Study, external app allows users to report daily whether they feel healthy, and record any symptoms.
The scientists have been using the data to estimate how the virus may have travelled through the population. Here are some of the things the app has taught us so far:
1. Infections actually rose after lockdown
When Prime Minister Boris Johnson called the UK lockdown on Monday 23 March, there were "a lot of infected people who suddenly were stuck together, and they infected each other", says KCL epidemiologist Prof Tim Spector.
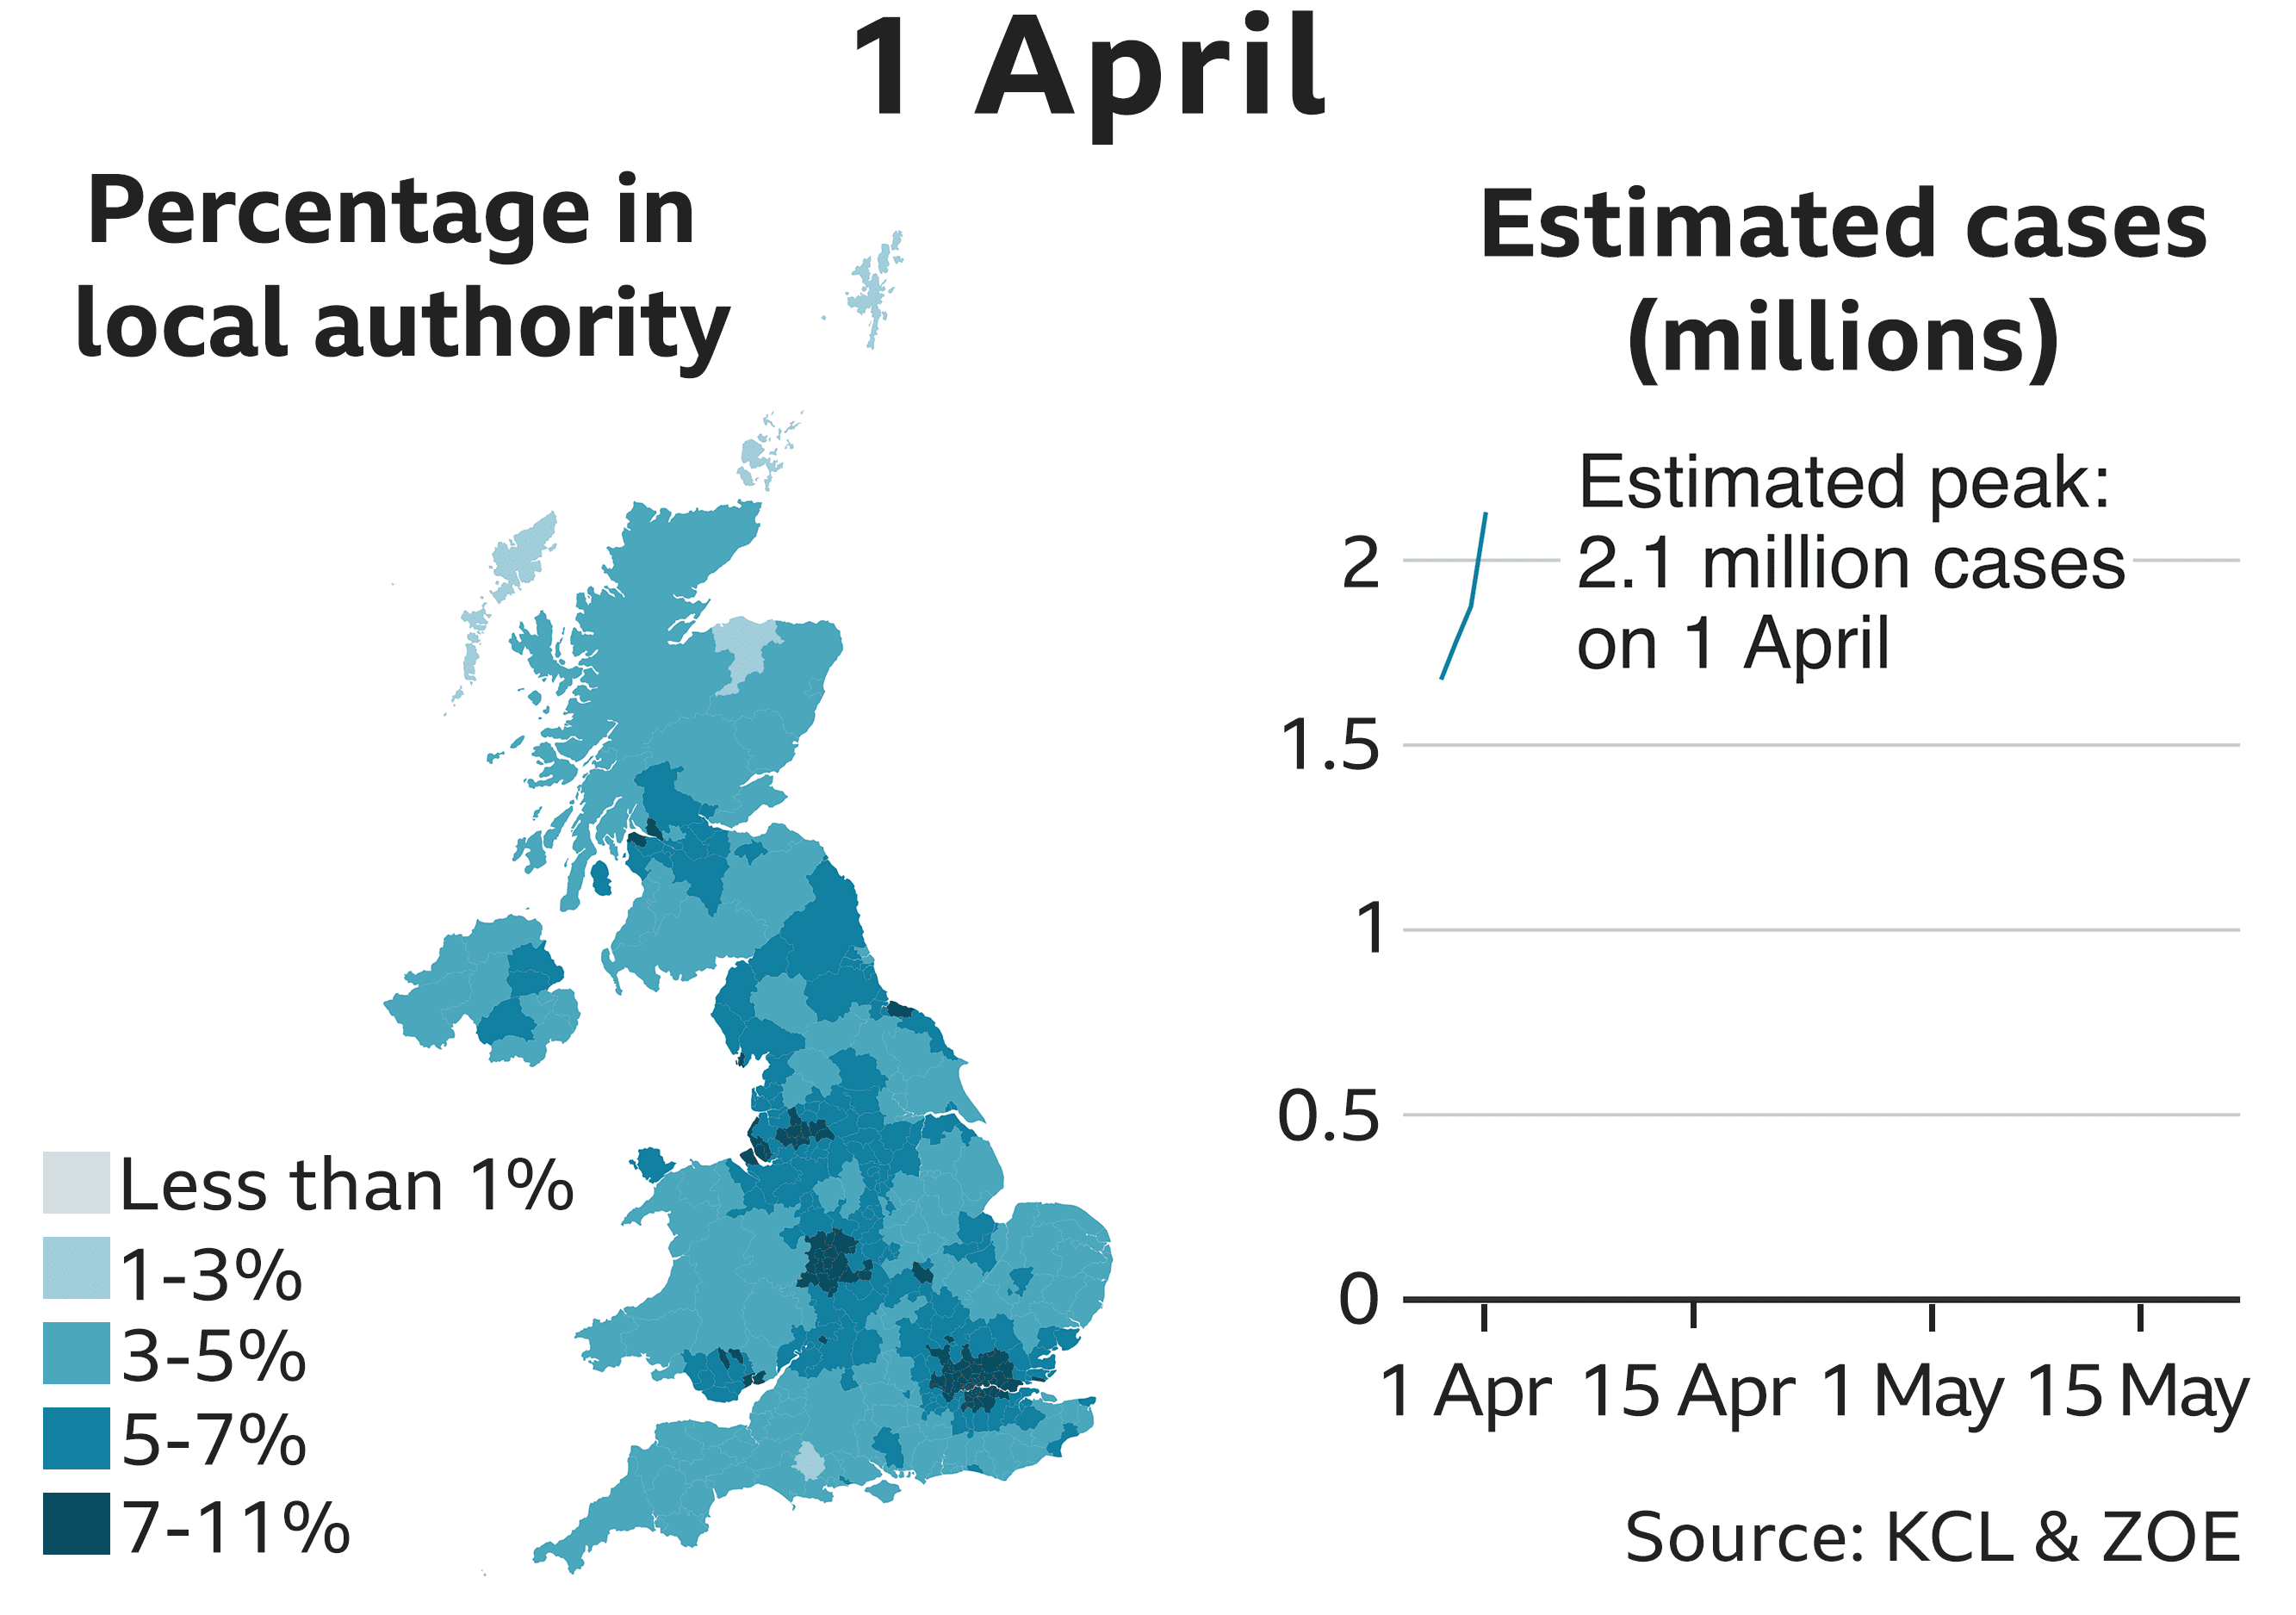
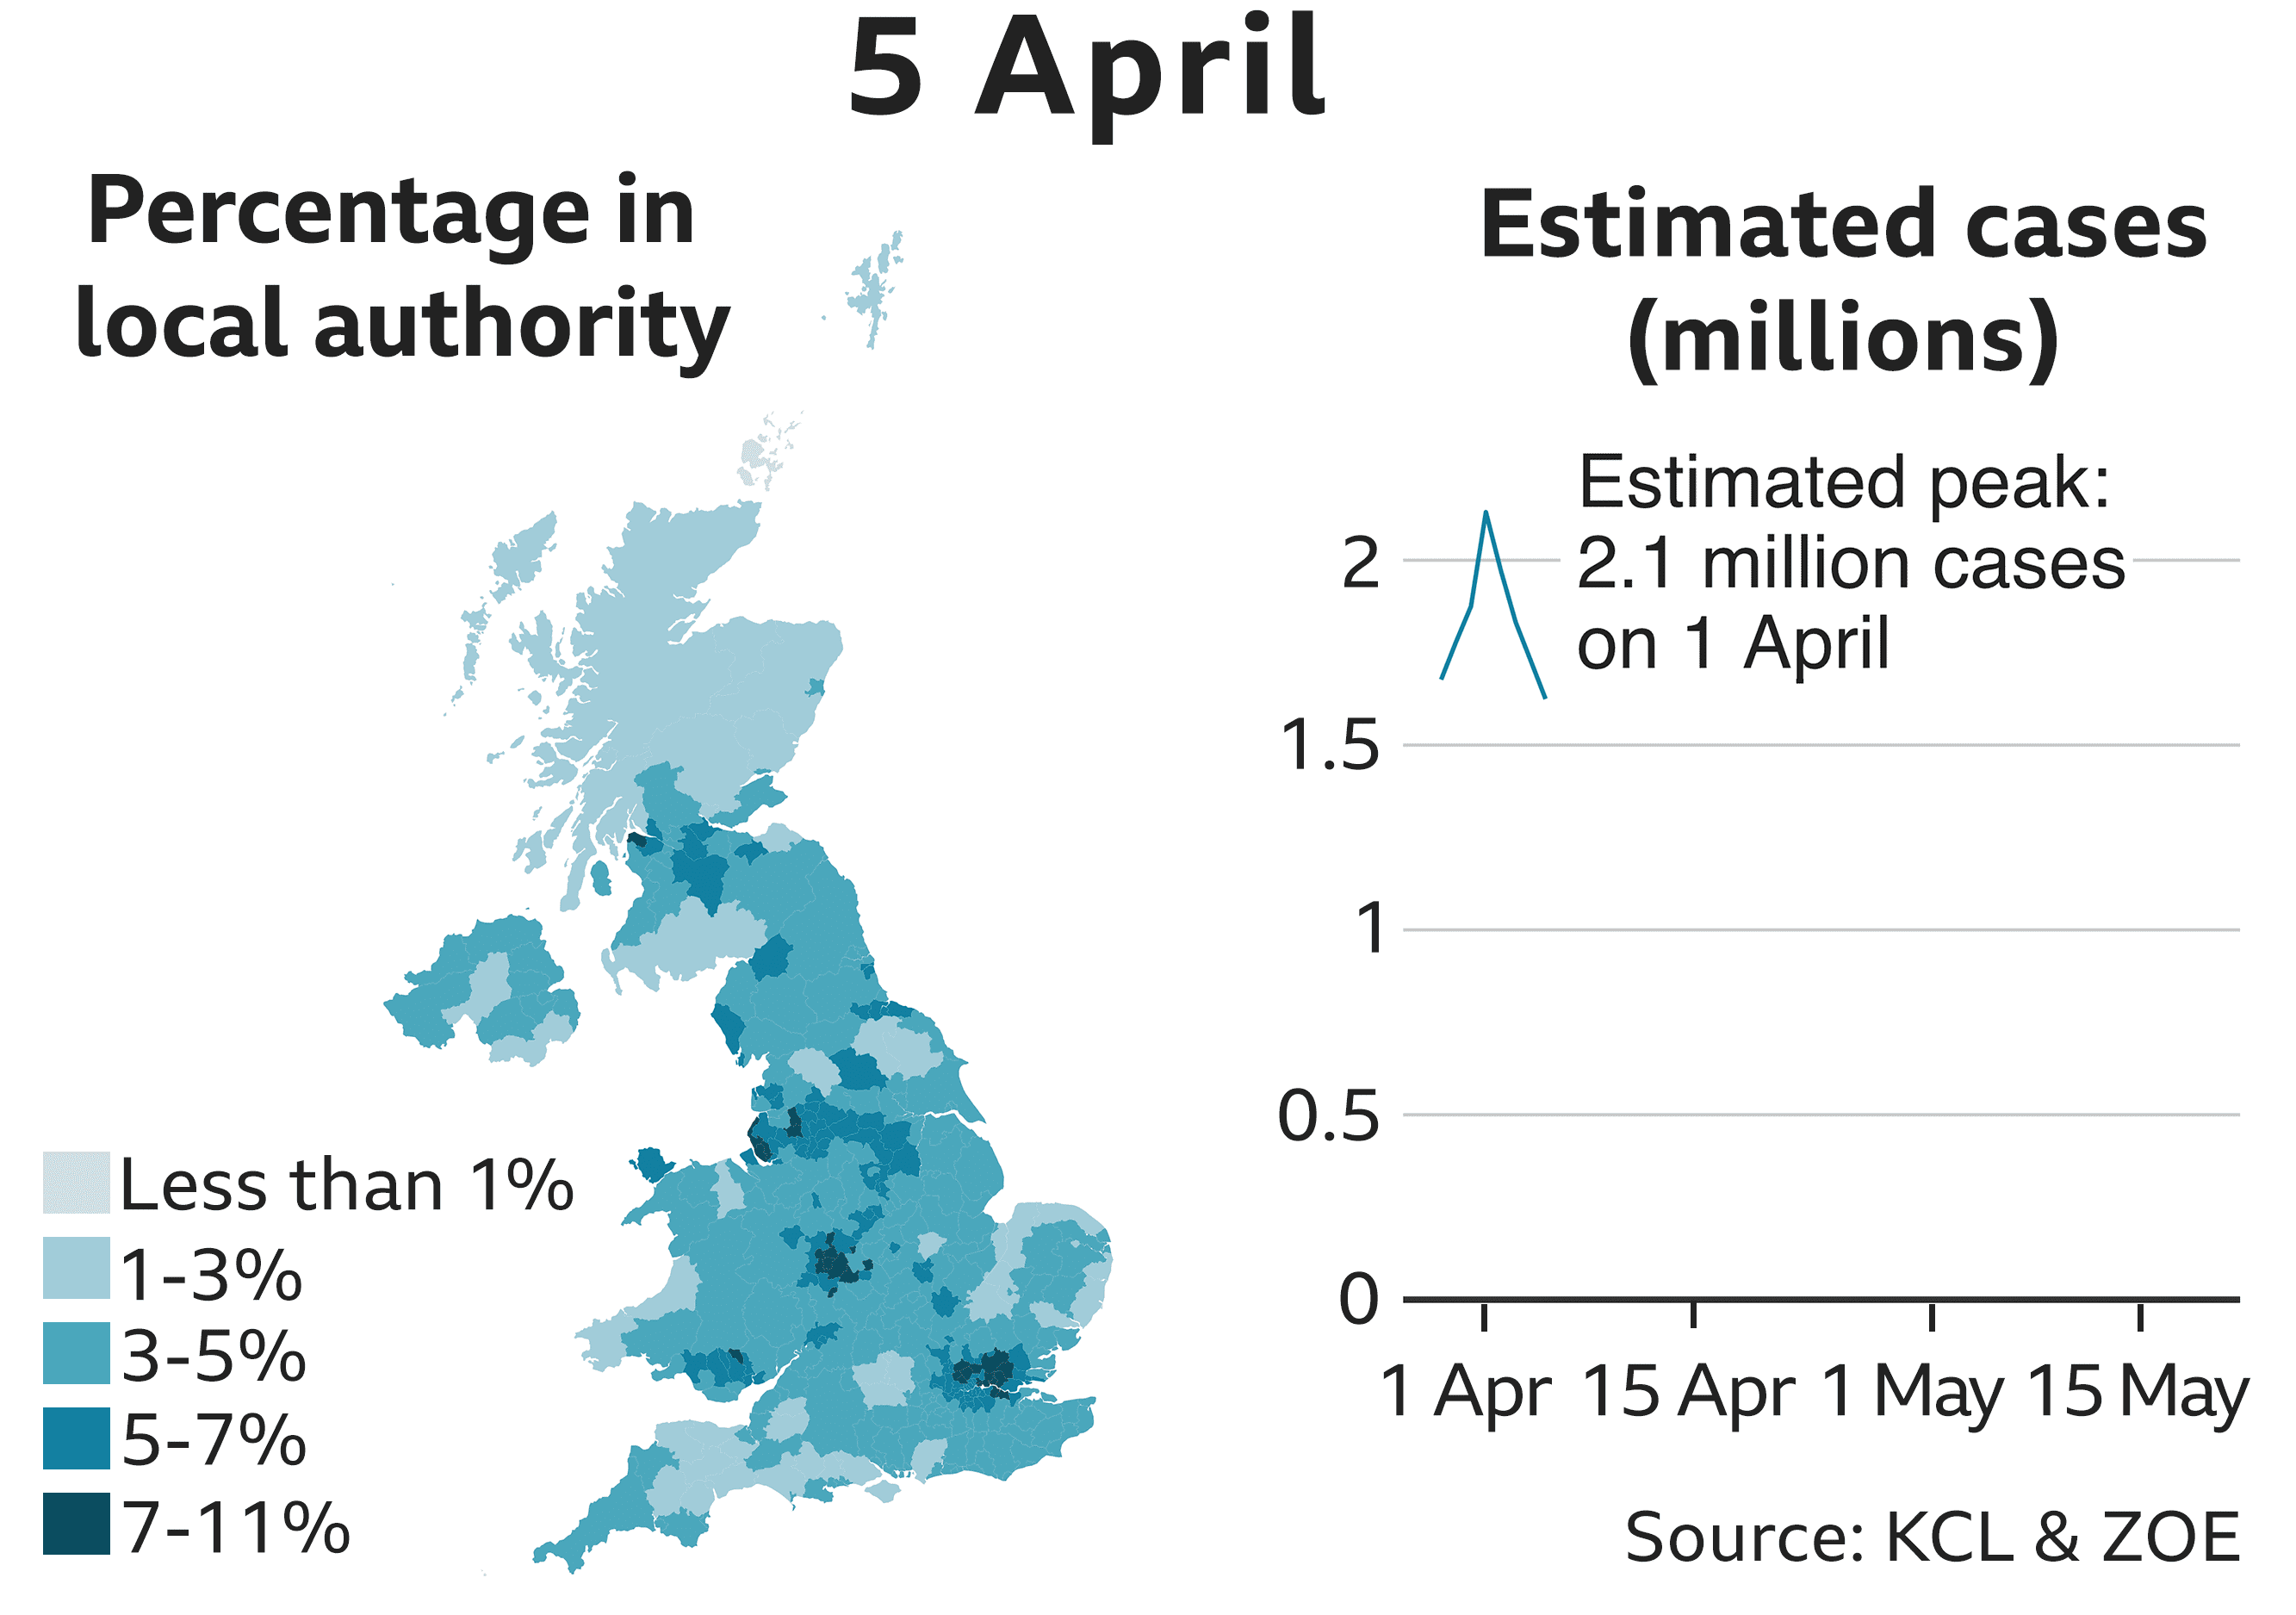
The peak of the epidemic came nine days later, the researchers believe, on 1 April. They estimate more than two million people aged 20-69 had Covid-19 symptoms in the UK at this point - or 50 in every 1,000 people.
The researchers found their app recorded a peak in infections several days before the peak in hospital occupancy, which Prof Spector says shows it is an "early warning device" for future changes in levels of the disease.
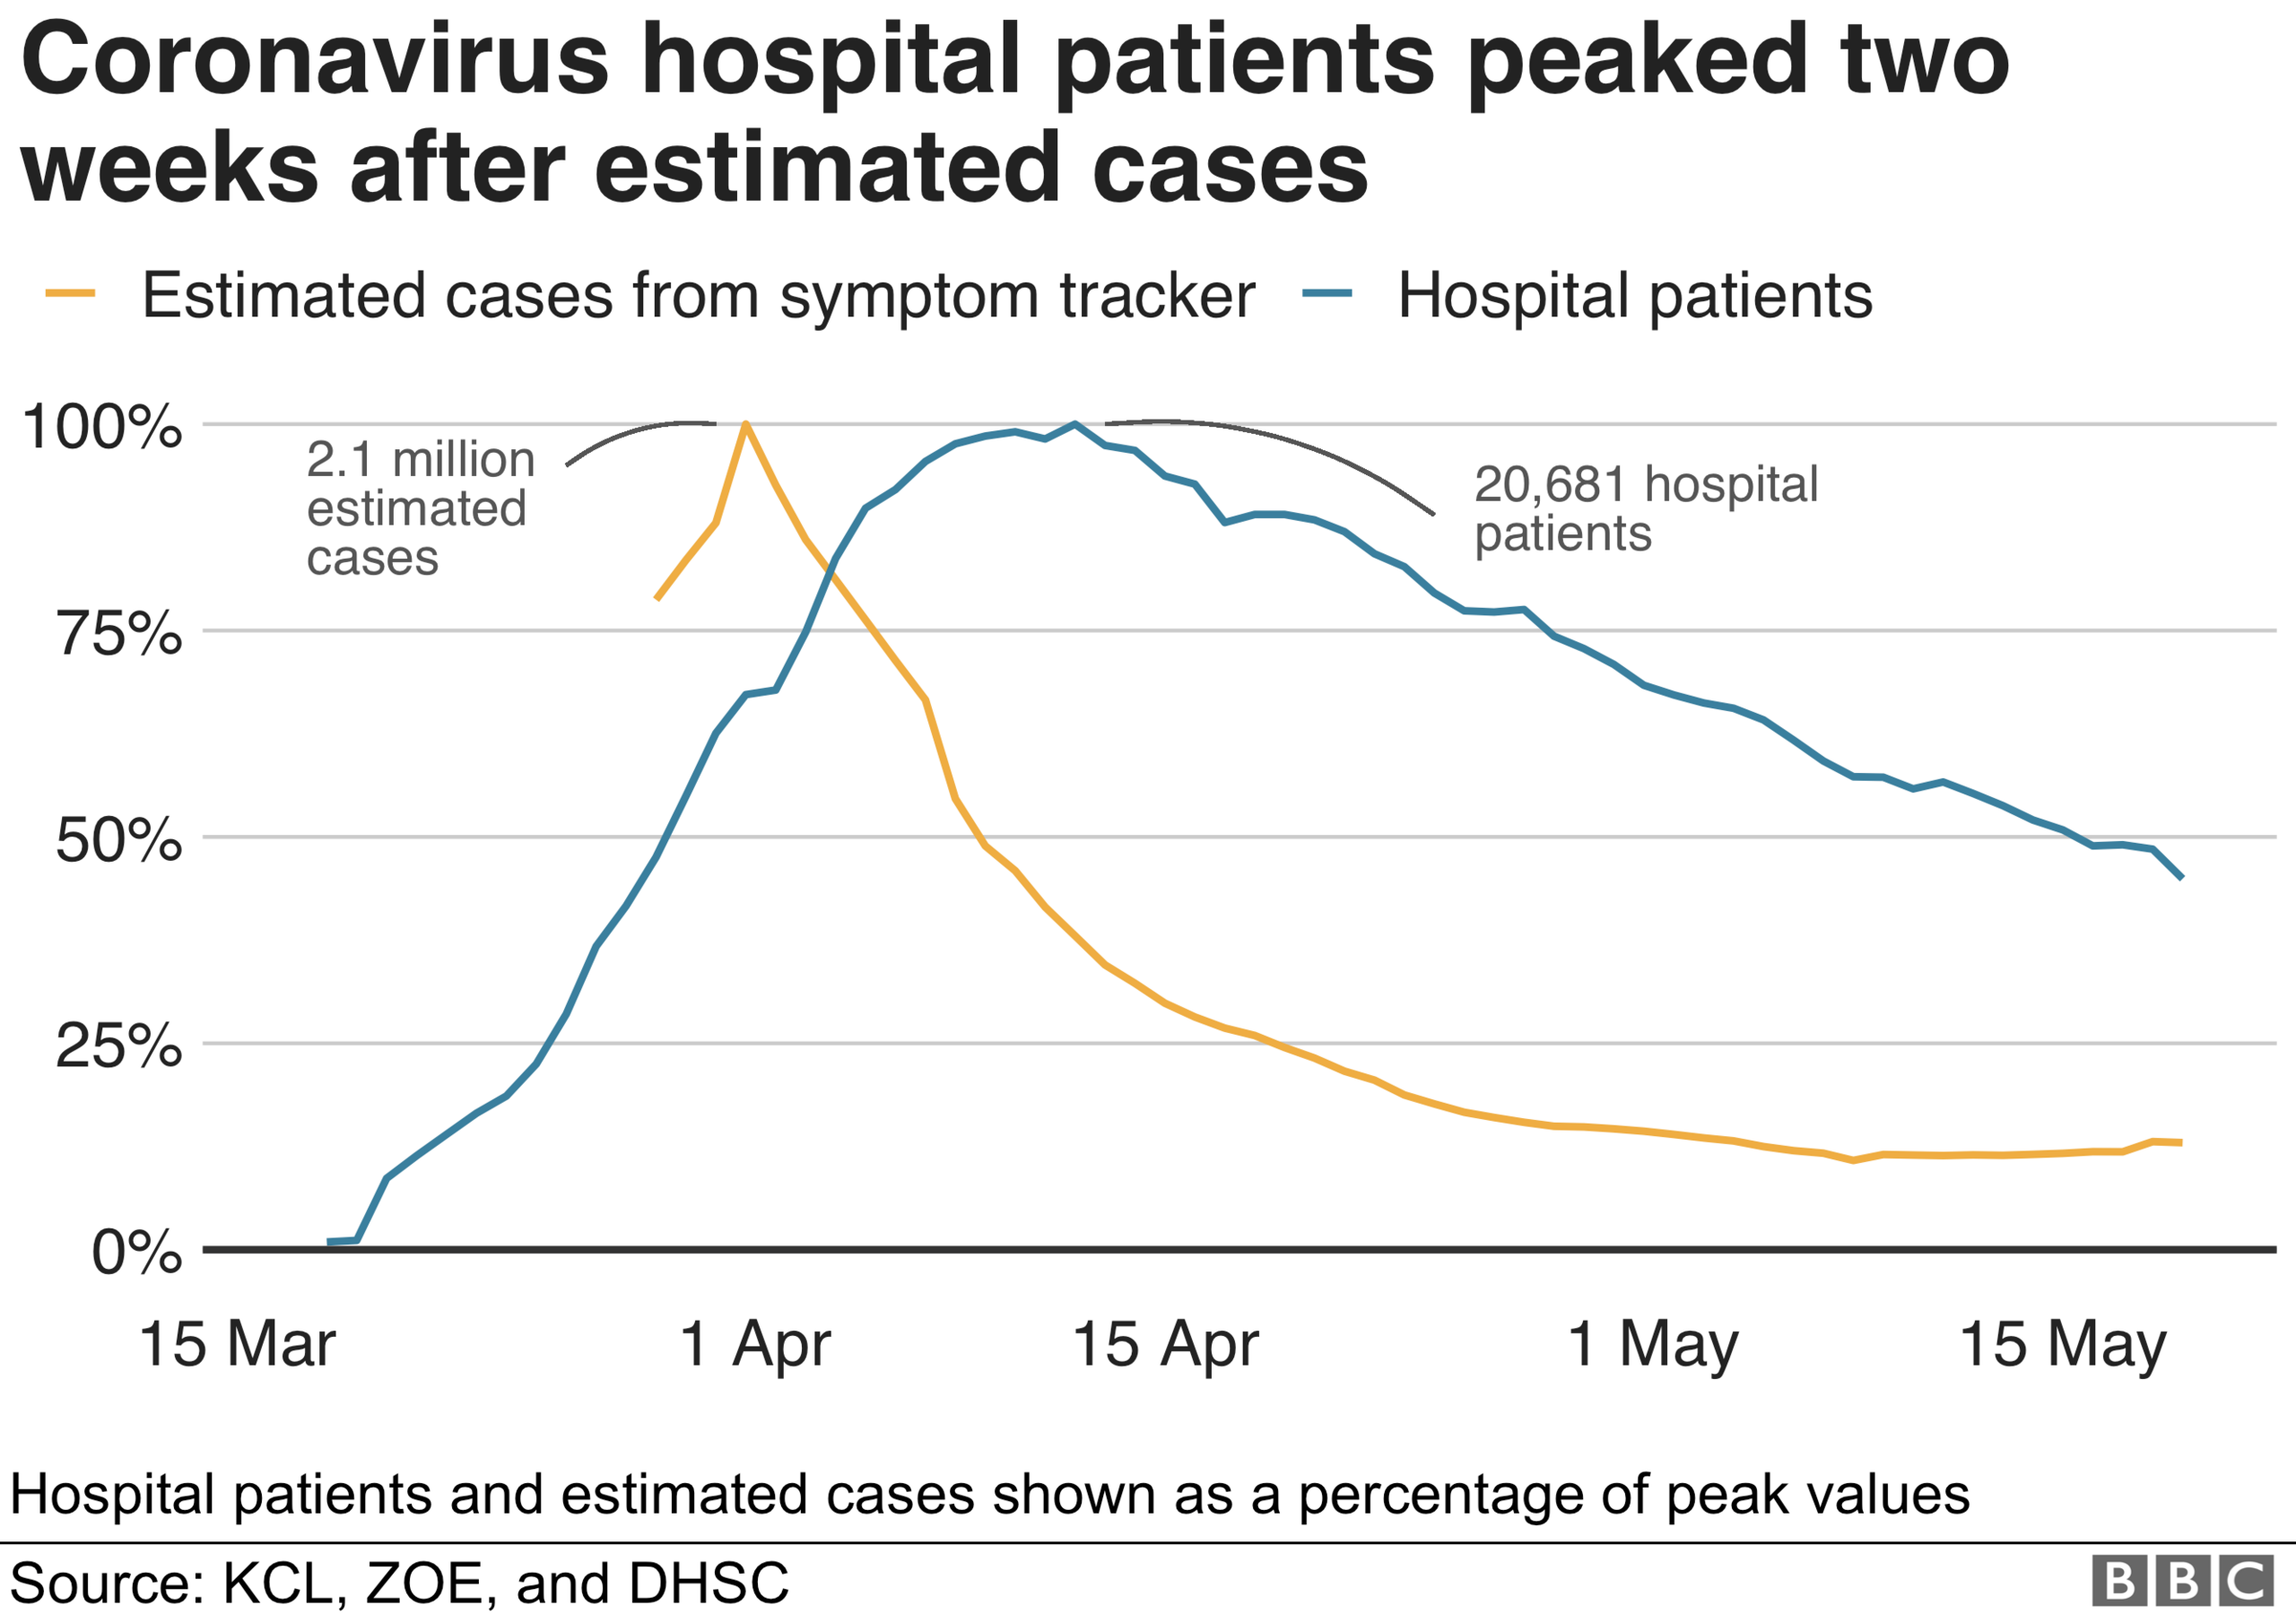
The average incubation period of the virus is five days but in some people symptoms take longer to show, meaning that a proportion of cases in the early days of lockdown were caught before it started.
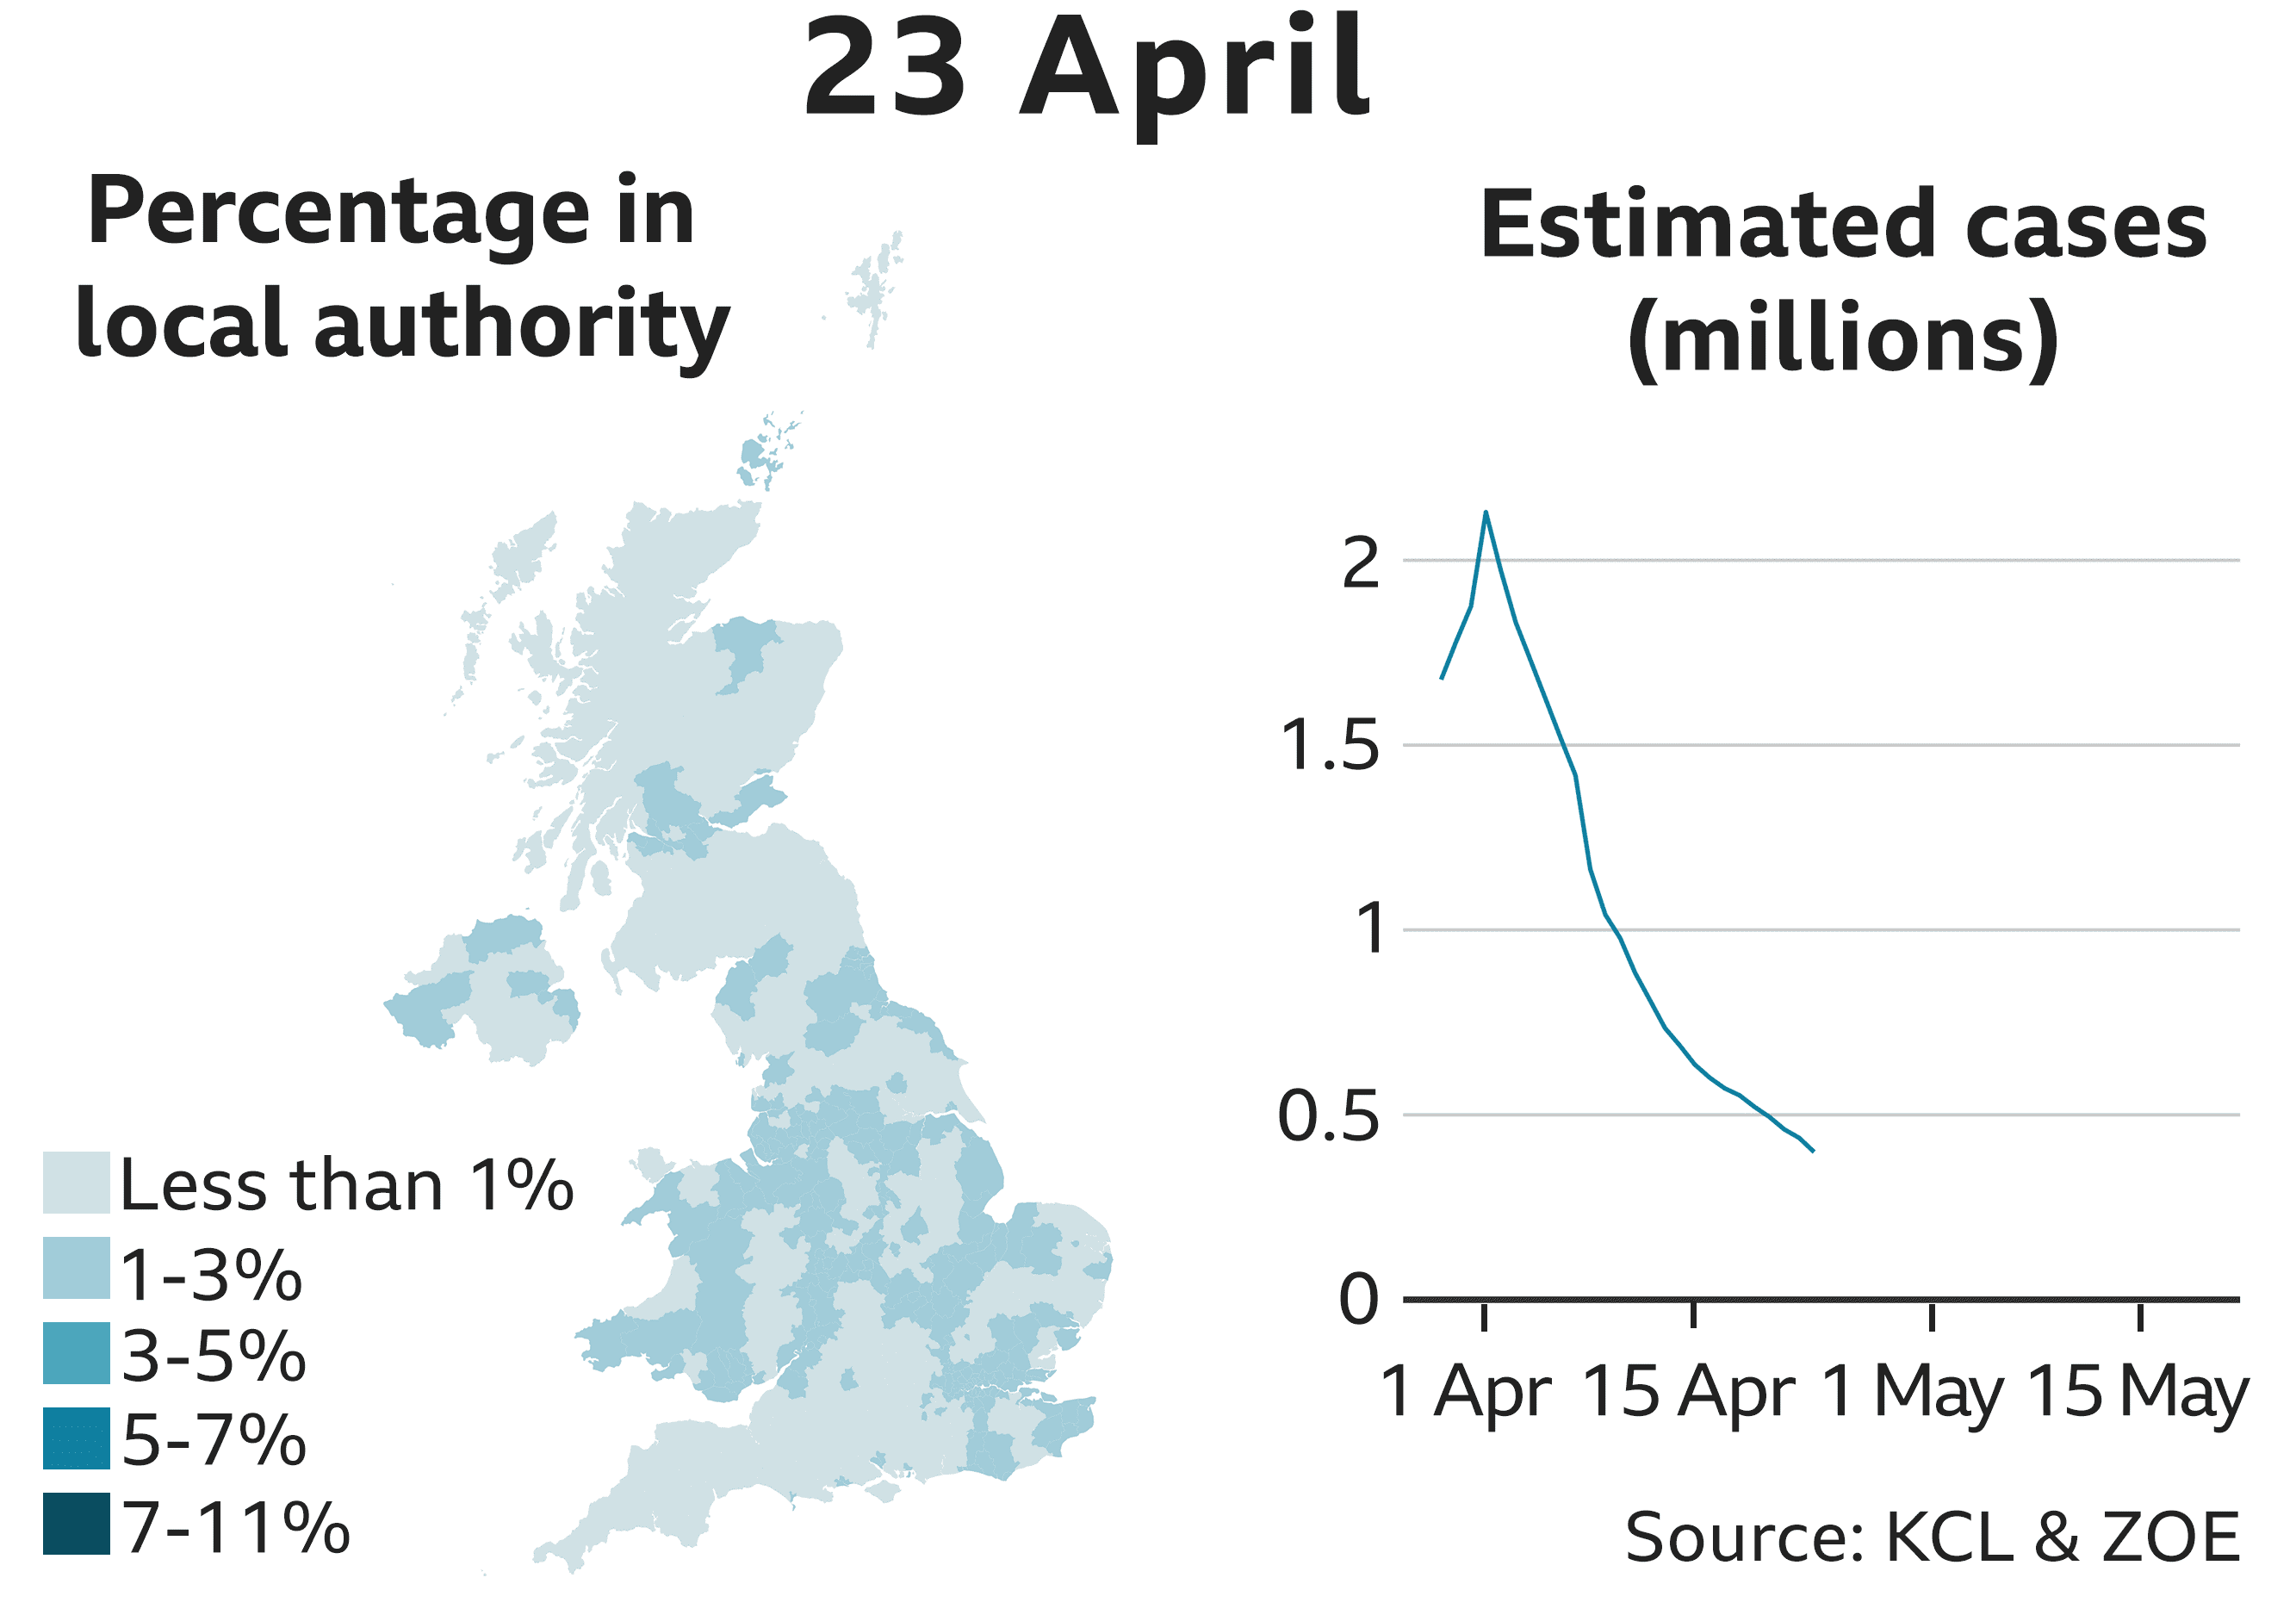
After 1 April, the number of infections plummeted in all the regions, but from different levels. Now the rate of the fall in estimated infections is decreasing, says Prof Spector.
"It was halving every week and then it slowed down. That rate of slowing is interesting - there are still some residual infections going on."
The number of cases in the general population is potentially being "driven" by problems in hospitals and care homes, he says.
2. Seven in every 1,000 people aged 20-69 currently have symptoms
The team estimates about 280,000 - or 0.7% - of people aged 20-69 have symptoms of the Covid-19, although they warn their model is less accurate when levels of the virus are low in the population.
If you can't see the slideshow, tap here, external
The Office for National Statistics (ONS) gives us a lower estimate, although so far it has only surveyed England. A swab test survey of nearly 15,000 people aged over two in the two weeks to 17 May, suggested 137,000 people in England - 0.25% - were infected. The same study by the ONS suggests there are 8,700 new infections a day on average in England, while a study by KCL on a group of 980,000 app-users suggests there are 9,900.
Both estimates come with margins of error of plus or minus a few thousand, so they are not as different as they might seem.

How does the study produce estimates?
By Maryam Ahmed, BBC News data scientist
The model predicts whether a person has coronavirus using their age, gender, and the symptoms they enter into the app. This gives a daily estimate of how many users aged between 20-69 have coronavirus in each local authority and age bracket. Researchers scale these figures up, using the population and age breakdown in each local authority, to predict the number of coronavirus cases in the general population.
Like all models, it doesn't get it right every time. The researchers say it will miss about 35% of people with coronavirus, and flag about 22% of healthy people. Since the predictions are based on app users, who tend to be younger and more affluent, the model might be less accurate when scaled up to the general population. The model doesn't make predictions for people under 20 or over 69, because of a lack of data.
KCL have been publishing their estimates on a daily basis, so the findings have not yet been peer-reviewed.

3. Disease increased after major sporting events
Areas that hosted sports events in the days before mass gatherings were cancelled, became infection hotspots, according to the research. Data suggested a high rate of infections in Cheltenham following the Gold Cup horse racing event, and a rise in Liverpool after a Liverpool v Atletico Madrid Champions League football game.
Liverpool City Council has since launched an investigation into the outbreak, but Gloucestershire County Council - which oversees the Cheltenham Festival - said any investigation should be led at a national level.

The Cheltenham Festival was described as the "best way" to spread the virus
4. A spike in south Wales remains a mystery
A map of the symptom-tracking app data demonstrates that, at the peak of the epidemic, the estimated cases were clustered in cities including London, Birmingham, Liverpool and Glasgow. But the researchers were surprised by a heavy concentration of estimated cases in south Wales - around a week before the height of hospital activity in the area.
"We never really understood why it was a hotspot. No-one's come up with a convincing explanation," says Prof Spector.
5. Scientists could predict how the disease will progress in different people
Although the government initially warned the key symptoms of Covid-19 were a fever or continuous cough, data collected by the symptom-tracking app suggests the disease has a wide range of symptoms. Fatigue, shortness of breath, diarrhoea, delirium, skipped meals, abdominal pain, chest pain and a hoarse voice were all associated with the virus.
But the strongest warning signs of infection are a loss of taste or smell, according to findings from the team, published in the journal Nature Medicine. These symptoms were added to the UK's list of those that people should self-isolate with on Monday, several weeks after Prof Spector and other experts had called for the guidance to be changed.
The KCL scientists have also noticed there are patterns in the different symptoms people with Covid-19 have, which they think form six distinct groups. They hope soon to be able to predict how the disease will progress in a person, based on the symptoms they have on the first day.
Interactive produced by Christine Jeavans and Maryam Ahmed. Design by Sana Jasemi and development by Steven Connor.
Correction 28th May 2020: An earlier version of this article referred to a peak in infections around two weeks before the peak in hospital admissions and this has been amended to make clear that the comparison was with hospital occupancy.
- Published21 May 2020
- Published22 May 2020
