Ukraine and US agree to an economic deal - follow alongpublished at 23:13 BST 30 April
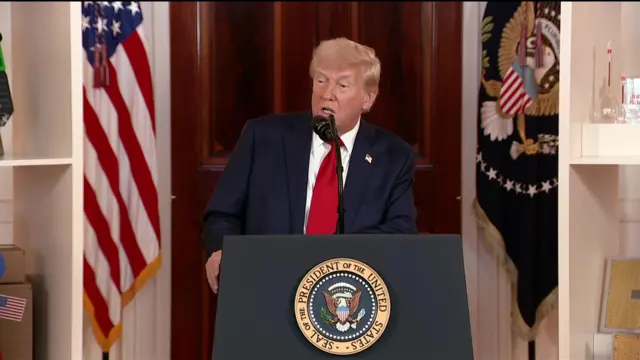
We've been covering a lot about the US economy today, and been following President Trump closely at his two public appearances.
But bubbling away in the background was the prospect of an economic deal between the US and Ukraine over rare earth minerals.
The two countries have now agreed to an economic partnership, deal the BBC understands.
A press release from the Treasury Department says the two countries have agreed to form a "Reconstruction Investment Fund", that will see them collaborate to ensure that "mutual assets, talents, and capabilities" can accelerate Kyiv's recovery.
We have been running separate live coverage on that, and we will closing this page to move over there to continue that coverage.
Do join us.


