Aura mission tracks global pollutant trends
- Published
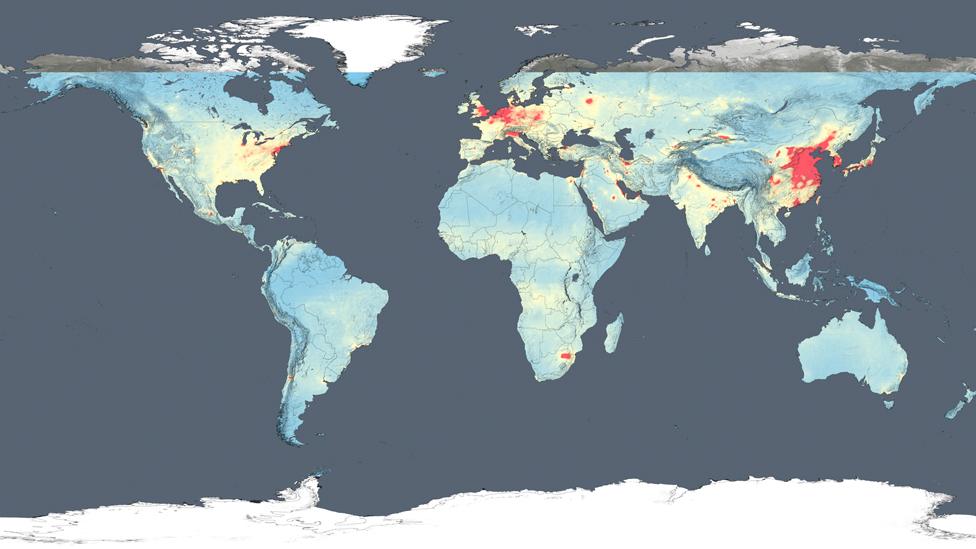
Omi's view of NO2 in 2014. Red denotes stronger emissions; the blues signify lower emissions
The success of clean air legislation in western developed countries is evident in the results from a 10-year study by a US space agency satellite.
The Aura mission has been tracking trends in emissions of nitrogen dioxide since its launch in 2004.
It has seen big falls in the pollutant in the US and Europe, while at the same time recording significant increases in some developing nations, such as China.
NO2 is produced in large part as a result of the burning of fossil fuels.
Key sources include the tailpipes of vehicles and the exhaust stacks of coal-fired power stations.
The yellow-brown gas will, in the right weather conditions, promote the production of ground-level ozone, which is a severe respiratory irritant.
Scientists working on the OMI instrument on Aura have analysed the whole period from 2005 to 2014, and have presented their findings here at the Fall Meeting of the American Geophysical Union - the world's largest annual gathering of Earth scientists.
In the US and Europe, which remain big emitters of NO2, they find there has been nonetheless considerable success in constraining the problem.
Levels have fallen 20-50% across North America over the study period, and in Europe by as much as 50%.
Environmental legislation is undoubtedly behind the declines, say the researchers, together with technology improvements that have helped scrub emissions.
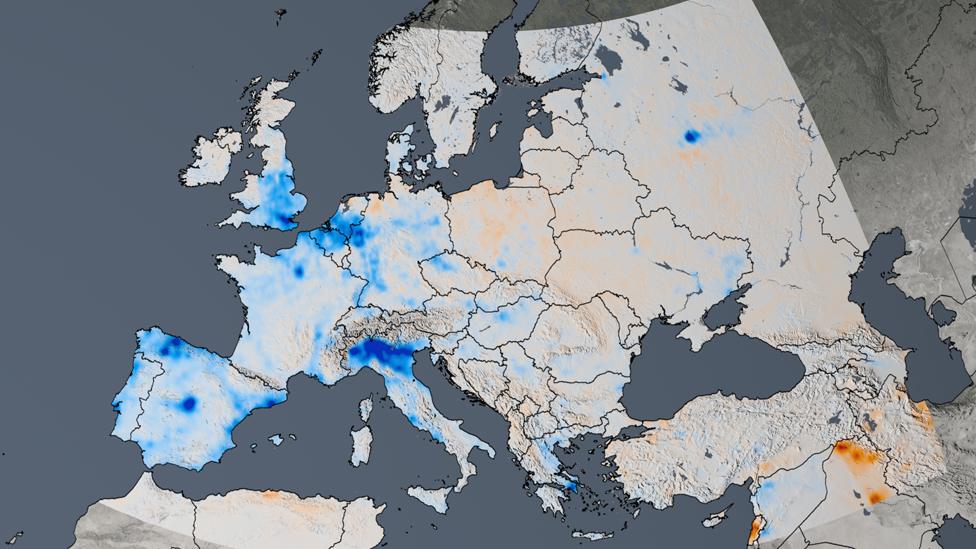
The trend for Europe 2005-2014: Blues show reductions over the period; reds are places where emissions have gone up

Despite the generally improving trend, some cities in the developed world still struggle to meet tough emissions limits
In a series of trend maps produced by the OMI team, the reductions are seen in blue.
The reds, on the other hand, denote increases in NO2 emissions. These are most obvious in developing nations.
A good example is China and its northern plain, which has become a major global manufacturing hub during the OMI time series.
"Nitrogen dioxide levels here have increased by 20-50% over the last decade. And the reason for this is that China's economic growth is being fuelled by its cheap and abundant coal," explained Bryan Duncan, an atmospheric scientist with Nasa.
Dig a little deeper into the data, however, and anomalies become apparent.
In China, some of the major cities have actually witnessed improved conditions. In Beijing and Shanghai, and in some of the cities of the Pearl River Delta, including Hong Kong, levels are down by up to 40%.
"This is local and regional governments working together to reduce their pollution," said Dr Duncan, "and a new affluent middle class demanding cleaner air."
Pieternel Levelt: "The quality of the data is still very good after 10 years"
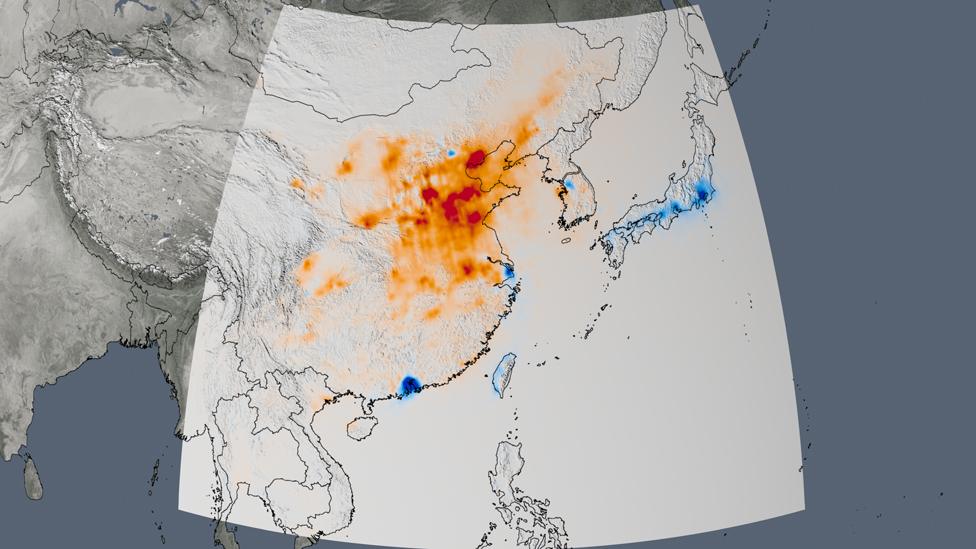
The trend map for East Asia showing strong increases in nitrogen dioxide concentrations from 2005 to 2014
Something similar is seen in southern Africa, where the Johannesburg-Pretoria metro area's emissions have bucked the rising trend of more industrial locations on the Highveld, the country's inland plateau.
And in the US, the general trend of success is contradicted in regions such as Texas and western North Dakota, where oil and natural gas exploitation has seen NO2 emissions rise.
"What's causing that increase? One is simply the heavy machinery - the trucks and all sorts of vehicles that are used in oil and natural gas extraction," said Anne Thompson, another Nasa atmospheric scientist.
"The other thing that happens is that not everything that is extracted is wanted and in a region like western North Dakota it [is] maybe the methane that comes up with the petroleum, and if they don't want it - they flare."
The scientists displayed pictures from another satellite, Suomi, which captures night-time lights. It easily picks out from space this practice of burning off unwanted gas.
The Middle East is an interesting case. Post 2005, NO2 increases are recorded in countries like Iraq, presumably because of economic growth picking up after the war years.
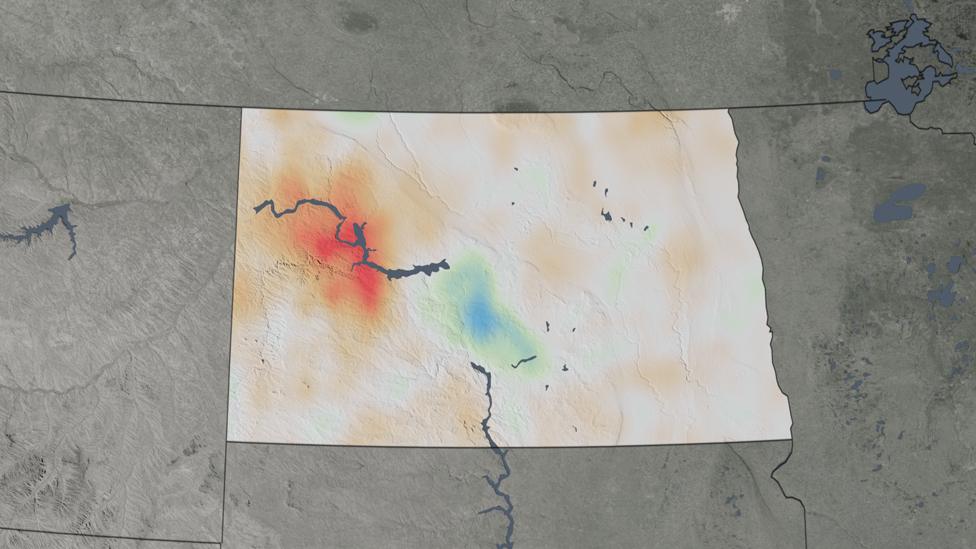
Nitrogen dioxide concentrations go up in western North Dakota from 2005 to 2014
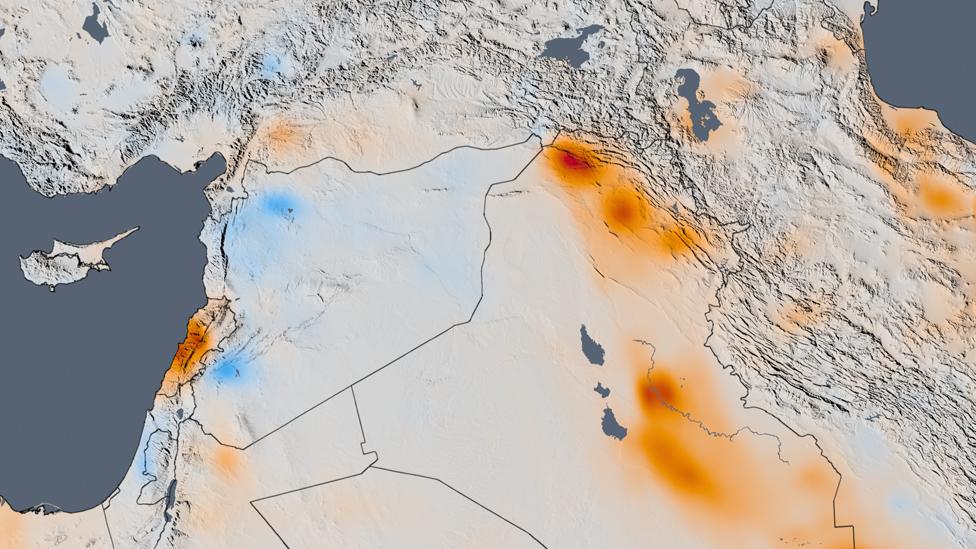
Turmoil in Syria is associated with lowering emissions in the country itself but rises in its neighbours
Conversely, declines have been seen in Syria of late. Researchers put this down to the collapse of economic activity and mass emigration as a result of the country's great upheaval. Corresponding spikes are seen in neighbouring nations, such as Lebanon and Turkey, where many of the displaced people have gone.
Omi is actually a Dutch and Finnish contribution to Aura.
European scientists are already working on its successor - an instrument called Tropomi, or "Super-Omi", which will fly on the EU's forthcoming Sentinel-5 Precursor satellite.
Pieternel Levelt from the Dutch Met Office told BBC News: "This new instrument will go to much higher resolution. That means 7-by-7km, so it's six times better. And it will also be more sensitive. This will allow us to see smaller sources."
Jonathan.Amos-INTERNET@bbc.co.uk, external and follow me on Twitter: @BBCAmos, external
- Published21 August 2015

- Published29 April 2015
- Published18 August 2015

- Published6 December 2012
