Map records UK's small ups and downs
- Published
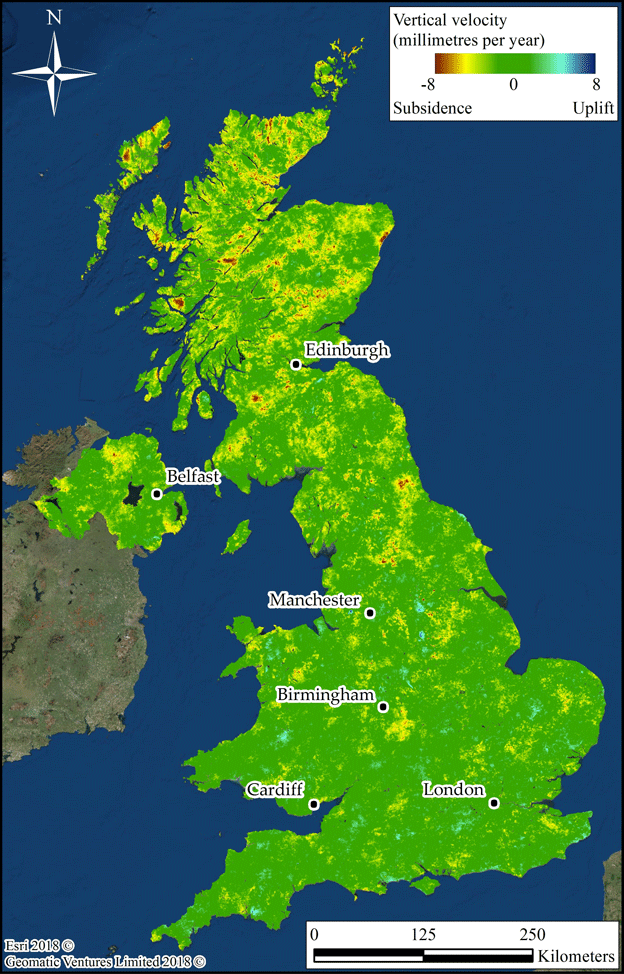
The map was produced from over 8 terabytes of radar data
The subtle warping of the land surface across the entire UK has been mapped in detail for the first time.
This view of changing topography was built from more than 2,000 radar images acquired by the European Union's Sentinel-1 satellites.
It should prove an invaluable tool for policymakers, and for industries working on big infrastructure projects.
The map reveals areas of subsidence and uplift, some of which, like those above old mine workings, could be hazardous.
Having detailed knowledge of their whereabouts, however, means the risks can now be properly assessed and mitigated.
For example, it can be seen how sections of the proposed route for the High Speed 2 rail link go across land that is still responding to the presence of coal pits at depth.
Some of the ground above disused tunnels is descending, while other locations are rebounding as water fills abandoned cavities.
The motion may be only millimetres per year, but it still needs to be recognised and factored into construction plans.
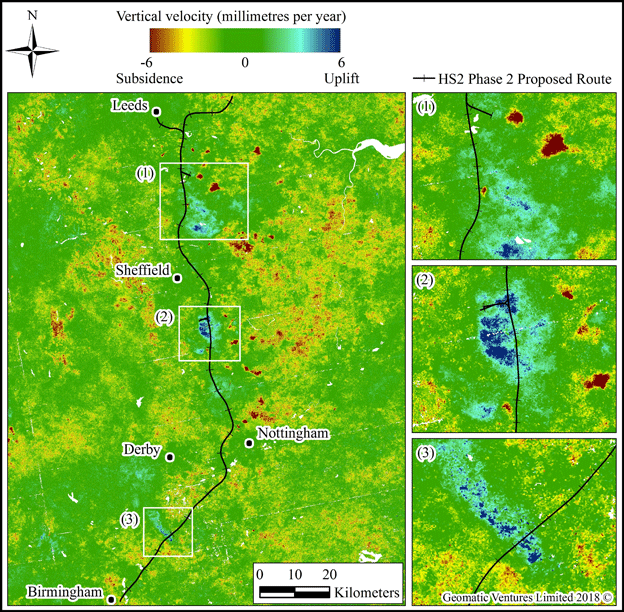
HS2 route (black line), running from Birmingham to Leeds. Areas of subsidence (red/brown) and uplift (blue) are all related to abandoned coal mining
The deformation map was assembled using a technique called satellite interferometry.
By overlaying repeat radar pictures of the same location, it becomes possible to discern even the smallest changes in a scene.
Developed some 25 years ago, the approach always worked best where the spacecraft could see specific hard features time and time again.
These "persistent scatterers" would be objects like the corners of city buildings. But a few years ago scientists from the University of Nottingham found a way to also capture changes where "soft" features, such as vegetation, dominated the landscape.
Using this Intermittent Small Baseline Subset (ISBAS) analysis, it is now possible to frame a full picture of Britain that incorporates both urban and rural terrain.
Geomatic Ventures Limited (GVL) is the company that has been spun out from the university to commercialise the technology. Its chief technical officer, Dr Andy Sowter, told BBC News: "Persistent scattering interferometry relies on points that absolutely persist through all observations, but with the Sentinel satellites we now have so many images that we can use points that persist only perhaps through two-thirds of the observations.
"In the past this data would have been thrown away, but we're able to be more selective, and that allows us to get at the full dynamic landscape for the first time."
It has to be said, there are groups in the satellite interferometry community that are yet to be convinced by ISBAS. These teams believe that tracking change in vegetated areas is still a major challenge.
"While this initial map shows the potential power of Sentinel-1 for deformation monitoring on a nationwide-scale, many in the community have legitimate concerns about the reliability of these particular results, especially outside urban areas," commented Prof Tim Wright from the University of Leeds.
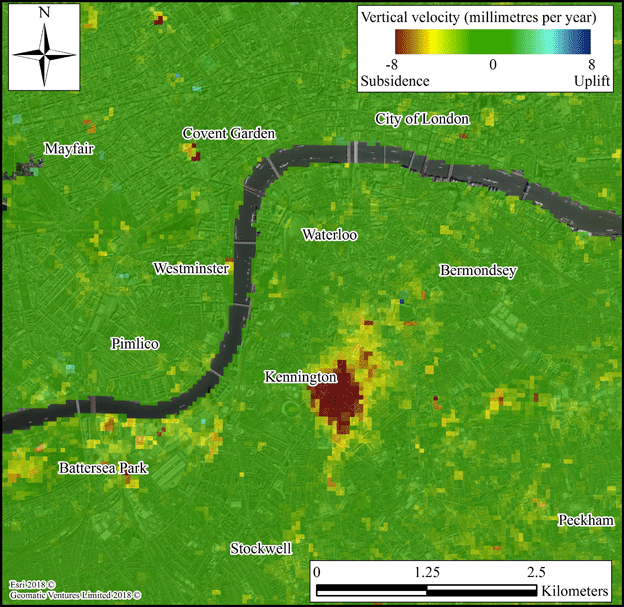
Tube extension: A large subsidence bowl (red/brown) just to the east of the Oval in London. The land level in this area has fallen by around 4cm over two years
The resolution of the map is about 90m. It will not show the movement in someone's backyard, but it can notice the major deformation features.
The map will be scoured for widespread compaction of soils, landslides, eroding coastlines, and the subsidence over landfill and underground works.
For the public release of the map, GVL has highlighted some examples of interest.
These include a 500m-wide zone of depression at Kennington Park, part of the Northern Line tube extension in London. This subsidence is most probably related to the sinking of a shaft that was completed in November 2017.
In the far north of Scotland, GVL has been monitoring the peatlands of Caithness and Sutherland - the so-called Flow Country. Subsiding bogs release greenhouse gases and so the satellite imagery is a way to keep a check on the UK's climate commitments.
"Probably the weirdest example we've come across is the 2cm per year uplift at a place called Willand in Devon. It's a small place on the M5 motorway. We've spoken to the Environment Agency and the British Geological Survey, and right now we can't explain it. We don't know why it's going up," said Dr Sowter.
The map was put together over a two-year period from 2015 to 2017. But it is essentially now an operational product that could easily be updated every three months.
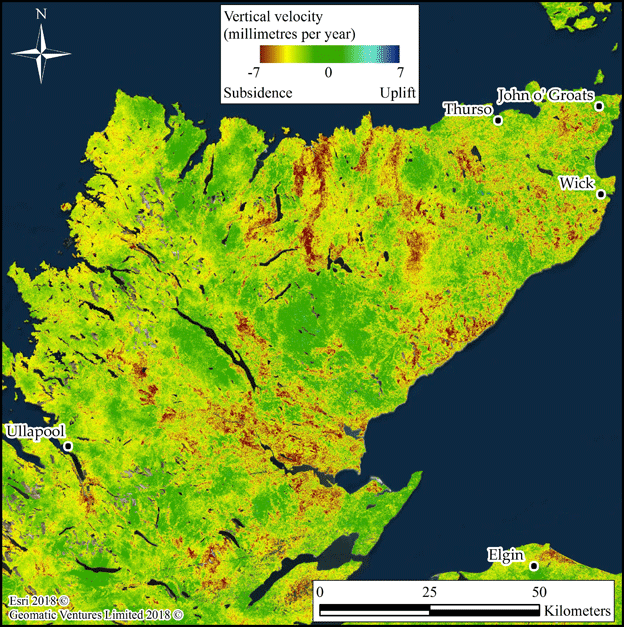
Northern Scotland's Flow Country is a large, globally important peat bog and stores about 400 million tonnes of carbon – more than double the amount in all the UK's forests
What makes this kind of offering possible is the avalanche of data being delivered from orbit by the EU's Sentinel satellite series. Six spacecraft have so far been launched to image the Earth in a variety of ways, not just radar. A further 14 are already funded to fly.
All the data is deliberately free and open so that outfits such as GVL can exploit it and innovate new business applications.
Dr Josef Aschbacher is the director of Earth observation at the European Space Agency, which procures and manages the Sentinels for the EU.
Speaking here at the European Geosciences Union (EGU) General Assembly in Vienna, Austria, he projected an explosion of data in the years ahead.
"Today we are producing 14 terabytes of data from the Sentinels alone. We are producing more data from our satellites than all the images and videos being uploaded to Facebook every day," he told BBC News.
He said his agency expected to be archiving some 100 petabytes of data by 2026 - all of it available to drive new services such as deformation mapping.
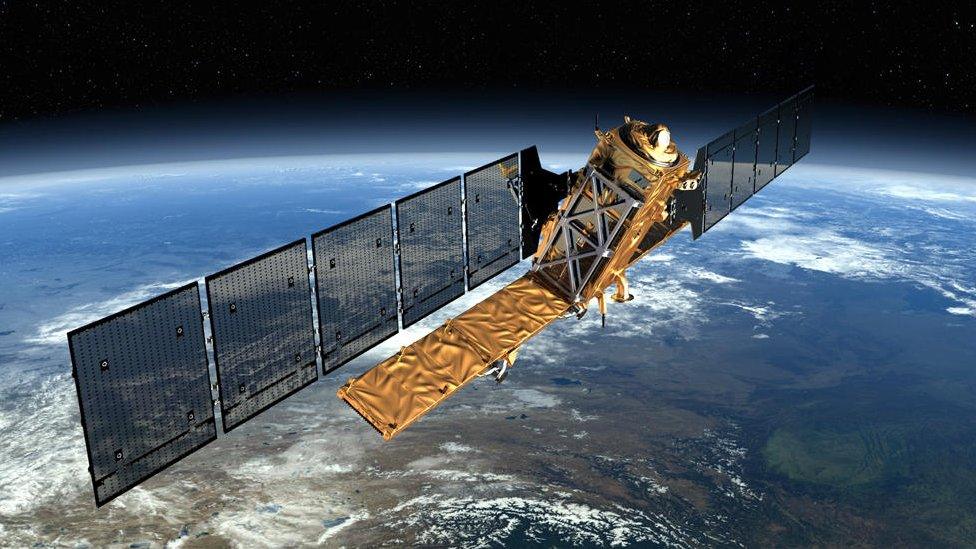
Artwork: The Sentinel radar satellites produce prodigious volumes of data
Jonathan.Amos-INTERNET@bbc.co.uk, external and follow me on Twitter: @BBCAmos, external