New Sentinel satellite tracks dirty air
- Published
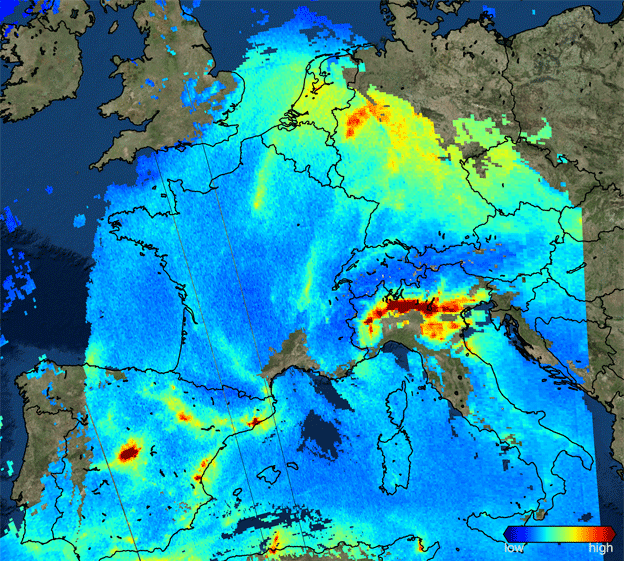
Nitrogen dioxide is concentrated over cities and industrial areas
It's been working less than a month but already the UK-Dutch-built Sentinel-5P, external satellite is returning spectacular new views of Earth's atmosphere.
The spacecraft was designed to make daily global maps of the gases and particles that pollute the air.
The first sample images released by mission scientists show plumes of nitrogen dioxide flowing away from power plants and traffic-choked cities.
S5P has even captured the ash and sulphur emissions from Agung volcano.
The mountain, sited on the Indonesian island of Bali, is in the midst of a big eruption.
Researchers, led from the Netherlands Met Office (KNMI), still have another five months of calibration work ahead to get the satellite's data ready for public use.
But it is clear, says principal investigator Pepijn Veefkind, that when fully operational, the new Sentinel will be an extremely powerful tool to monitor air quality.
"It's been amazing to see how quickly we were able to get the satellite working. This is a big improvement on what we've been able to do before. In just a week, we've got more data out of Sentinel-5P than in several years of operation of a previous mission," he told BBC News.
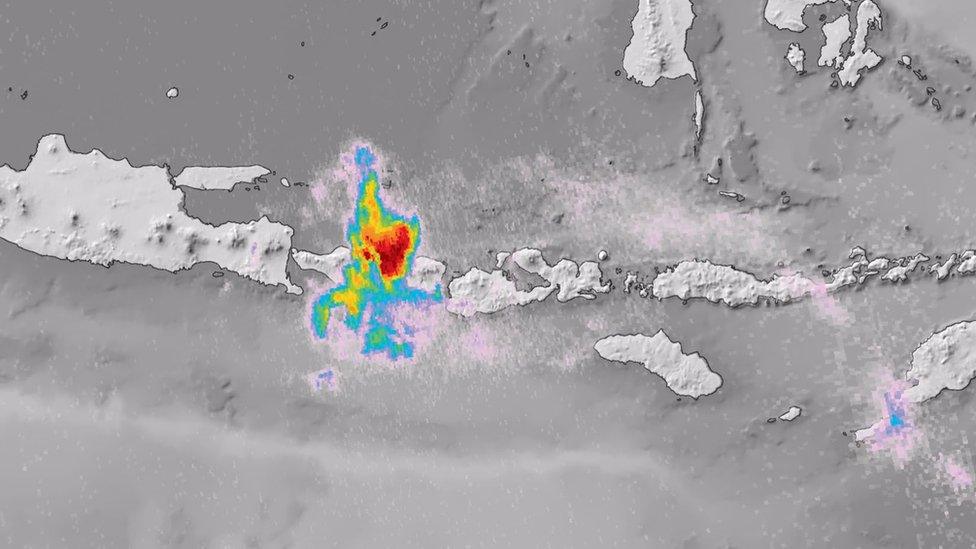
Mount Agung's emissions of sulphur dioxide could temporarily cool the global climate ever so slightly
Sentinel-5P is the latest spacecraft in a fleet of Earth observers being commissioned by the European Union and the European Space Agency.
Built by Airbus in Britain, the new spacecraft was launched into an 824km-high orbit by a Russian rocket on 13 October.
It carries a single instrument called Tropomi. This is a spectrometer that observes the reflected sunlight coming up off the Earth, analysing its many different colours.
In so doing, it can detect the presence in the atmosphere of a suite of trace gases such as nitrogen dioxide, ozone, formaldehyde, sulphur dioxide, methane, carbon monoxide and aerosols (small droplets and particles).
All affect the air we breathe and therefore our health, and a number of them also play a role in climate change.
The sample images were released during a briefing event at the German space agency in Oberpfaffenhofen near Munich. It is where Sentinel-5P’s data is processed.
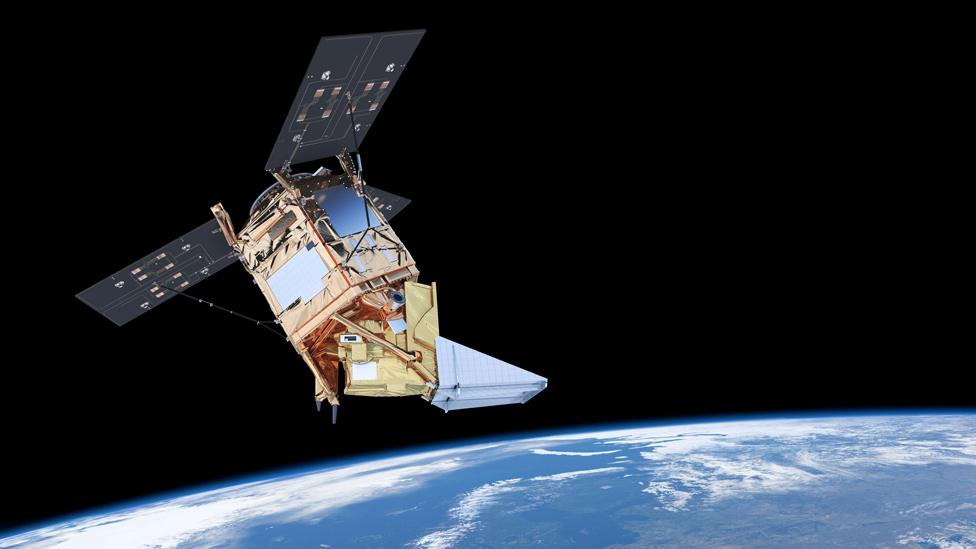
Artwork: S5P is the first Sentinel whose construction has been led from the UK
One of the first images shows nitrogen dioxide over Europe. These emissions come largely from motor vehicles and the combustion of fossil fuels in industrial processes.
High concentrations of the pollutant are evident over parts of the Netherlands, the Ruhr area in western Germany, the Po Valley in Italy and over parts of Spain.
NO2, a yellow-brown gas, will, in the right weather conditions, promote the production of ground-level ozone, which is a severe respiratory irritant.
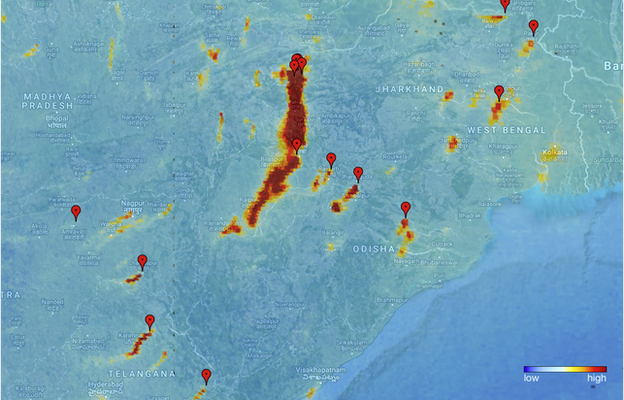
NO2 emissions coming from power plants in India
Another sample image shows pollution drifting away from power plants in India. The worst of this pollution runs from north of Patna in the state of Bihar to south of Raipur in the state of Chhattisgarh.
Another image is a global map of carbon monoxide.
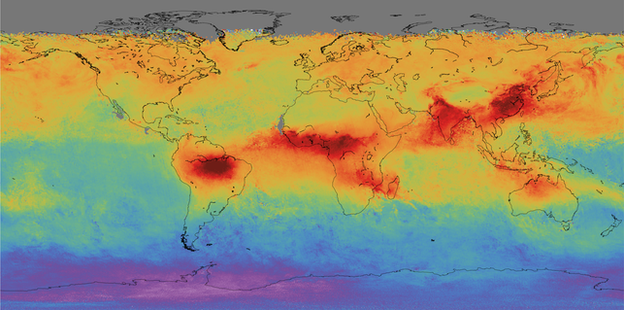
Carbon monoxide: There is a clear difference between the northern and southern hemispheres
Dr Veefkind explained: "You see straight away the difference between the northern and southern hemispheres. But you also see the strong concentrations over Amazonia, central Africa and Madagascar that are the result of biomass burning. We see some fires over Australia, too. Look also at how the pollution from China spreads out over the Pacific."
Perhaps the most topical image is the one of Mount Agung. S5P sees both the ash and sulphur dioxide coming out of the volcano. If Agung's activity increases substantially, these emissions have the potential to travel high and wide in the atmosphere, cooling the global climate by shading the planet from incoming solar radiation.
Sentinel 5P is an important British contribution to the EU/Esa Sentinel satellite constellation.
UK industry has provided components for other spacecraft in the series already in orbit, but 5P is the first platform whose construction was led from Britain.
"It's fantastic to see the power of Europe's Sentinel-5P, both globally and in close-up on sources of pollution," said Airbus UK executive Dr Ralph Cordey.
"It shows the close link between skilled engineering and the understanding and monitoring of our planet's atmosphere. Here in the UK, industry has led the satellite and built important parts of the Tropomi instrument - we should be very proud of that."

The EU/Esa Sentinel series of satellites
Sentinel-1: Radar satellite that can see the Earth's surface in all weathers
Sentinel-2: Multi-wavelength detectors to study principally land changes
Sentinel-3: Similar to S2, but tuned to observe ocean properties and behaviour
Sentinel-4: High-orbiting sensor to measure atmospheric gases
Sentinel-5: Low-orbiting atmospheric sensor to help monitor air quality
Sentinel-6: Future version of the long-running Jason sea-surface height series

The "P" in the spacecraft's name stands for "Precursor".
This references the fact that the Tropomi instrument onboard comes before a near-identical sensor that will eventually fly on Europe's next-generation weather satellites from 2021.
Putting up 5P now also ensures there is no data gap in observations should an ageing, previous-generation instrument suddenly fail.
That sensor, called Omi, flies on the US space agency's Aura satellite.
Although still in good health, it is operating far beyond its design lifetime.
Tropomi is more than a mere gap-filler, however. It has 10 times better resolution, seeing features in the atmosphere as small as 7km by 3.5km. And while this cannot distinguish particular point sources of pollution, this vision is sufficiently sharp to distinguish what is happening over sub-city scales.
Jonathan.Amos-INTERNET@bbc.co.uk, external and follow me on Twitter: @BBCAmos, external