People aged 65 to 79 'happiest of all', study suggests
- Published

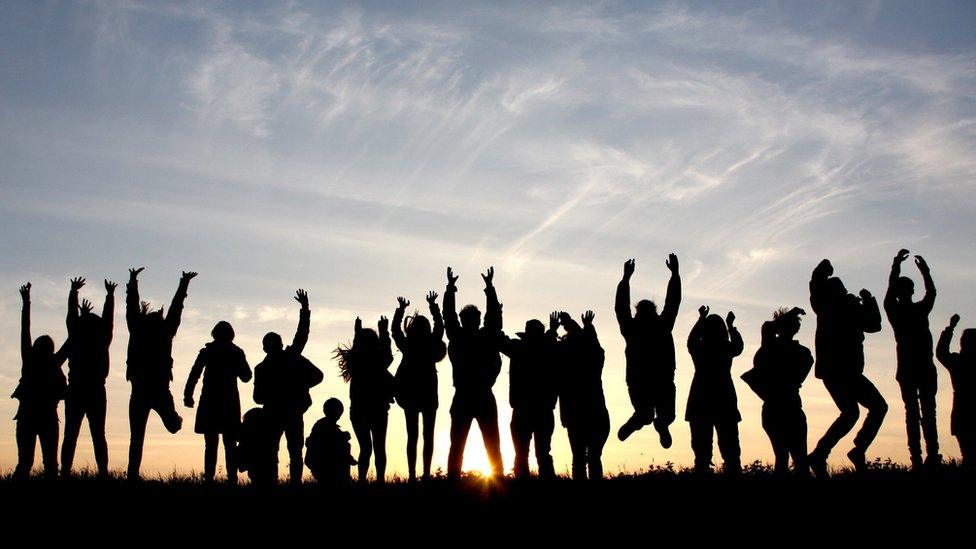
Sixty-five to 79 is the happiest age group for adults, according to Office for National Statistics research.
The survey of more than 300,000 adults, external across the UK found life satisfaction, happiness and feeling life was worthwhile all peaked in that age bracket, but declined in the over-80s.
Those aged 45 to 59 reported the lowest levels of life satisfaction, with men on average less satisfied than women.
That age group also reported the highest levels of anxiety.
Researchers said one possible reason for the lower happiness and well-being scores among this age group might be the burden of having to care for children and elderly parents at the same time.
The struggle to balance work and family commitments might also be a factor, they said.
113-year-old Gladys Hooper on the secret of happiness
Meanwhile, those who were younger or retired had more free time to spend on activities which promoted their well-being, the researchers suggested.
Happiness and well-being dropped off again in those over 80, however, with researchers suggesting this could be down to personal circumstances such as poor health, living alone and feelings of loneliness.
The survey asked people to rate out of 10 how happy and how anxious they had felt the day before, how satisfied they were with their life generally, and how much they felt what they did in life was worthwhile.

The published results have been broken down by age, ethnicity, religion, marital status, employment status, religion, and where in the country people live.
They suggested:
Married people had the highest levels of happiness, averaging 7.67 out of 10, higher than co-habiting, single, widowed or divorced people
People with jobs were happier than unemployed people, with part-time workers the happiest. Of those are were not working, retirees had the highest levels of happiness, followed by students
Of those who followed a religion, Hindus were marginally the happiest on average, followed by Christians and Sikhs, while those who followed no religion were the least happy
Women on average reported higher levels of anxiety than men, but were more likely report better well being and feel their life was worthwhile
People of Arab ethnicity were found to be the most anxious ethnic group, with people of Chinese ethnicity the least anxious
Northern Ireland held on to the crown for happiest of the UK's nations, with people there also most satisfied and most likely to say their life was worthwhile - but also the most anxious; the least happy people were in England, with the North East the unhappiest region

Take the test: Where in Britain would you be happiest?

Research shows the better you fit into the personality of your area, the happier you are. Take the test to find the best place in Britain for you
Read more on happiness from BBC News:
"Happiest" places in England revealed
Researchers found a strong link between health and well-being.
People who said their health was very good reported an average life satisfaction rating of 8.01 out of 10, compared with people who said they were in very bad health, whose average rating was just 4.91.
Ageing population

How satisfied are you with your life nowadays? The ONS mapped regional responses
Office for National Statistics' interactive maps, external
The over-90 age group reported by far the lowest levels of feeling their life was worthwhile, even though their reported levels of happiness and life satisfaction were comparable to those in their 20s and 30s.
Understanding how people of different ages rated their personal well-being could help policy makers target issues to improve lives, the study added.
The Dalai Lama has given his blessing to mindfulness classes
"We know that the UK population is ageing. There were more than half a million people aged 90 and over living in the UK in 2014 - almost triple the number 30 years ago," it said.
"This shift towards an older population will impact on important policies and services including the labour market, pension provision, and health and social care demand.
"Understanding more about how the oldest age groups rate their personal well-being will help focus on issues that are fundamental to a good later life."
Happiness around the world

The "U-shaped" pattern of happiness, which sees people's happiness dip in middle age, has been observed globally.
It has been documented in more than 70 countries, in surveys of more than 500,000 people in developing and developed countries, although the age at which happiness is lowest differs between countries.
Previous studies found happiness hits rock bottom at 35.8 years in UK; the low point in the US comes a decade later; in Italy, happiness is lowest at 64.2 years
US citizens have become less happy with each passing decade since 1900; in Europe, happiness declined until 1950 and has been increasing steadily ever since
Women are at their least happy at 38.6 years on average; males hit low point at 52.9 years
Apes, like humans, may also suffer from midlife melancholy - that's according to a study of 508 apes in which their human care-givers assessed their well-being
- Published2 February 2016

- Published3 February 2016

- Published23 September 2015
- Published6 November 2014

- Published1 July 2013
- Published4 December 2012
- Published16 November 2010


