10 charts that tell the story of Britain's roads
- Published
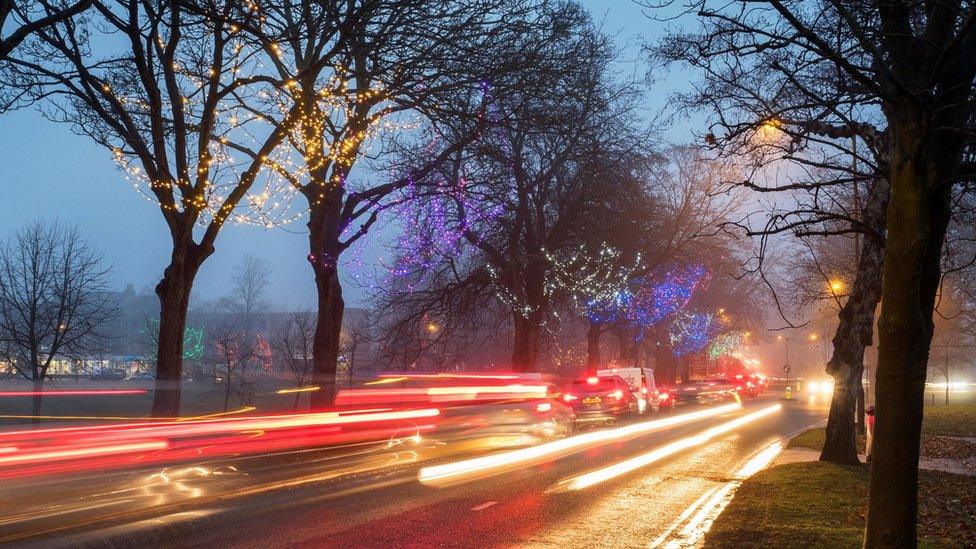
The Friday before Christmas is one of the busiest days of the year for traffic, with drivers being warned to expect long delays. On a normal day, the average person in this country spends an hour a day travelling, with most of their journeys made by car. These charts tell the story of Britain's roads.
1. The vast majority of our journeys are by car
Back in 1952, less than 30% of distance travelled in Britain was by car, van or taxi. 42% was by bus or coach, and 17% by train.
As people got richer and cars got cheaper, the picture changed rapidly.


By 1970, three-quarters of all passenger kilometres were by private vehicle. The proportion reached 85% in the late 1980s and has stayed roughly constant since then - as has the total distance driven each year.
Public policy encouraged driving in the post-war period, according to Richard Blyth of the Royal Town Planning Institute.
New suburbs were more spread out. The first motorway, Lancashire's eight-mile Preston bypass, opened in 1958 and now forms part of the M6. Meanwhile less money was invested in public transport, especially buses, says Blyth.
Travel by bus and coach has been in long-term decline, accounting for just 4% of total distance travelled in 2016, a tenth of the figure of the early 1950s.

Away from the roads, rail fell to a low of 5% in the mid-1990s but has steadily increased - it's 10% now.
The average amount of time each person spends travelling each day is about one hour, and surprisingly this has been fairly constant since the 1960s.
But average speeds have increased, especially for rail, so people can go further in the same amount of time.
This means people are commuting greater distances, especially in the crowded south-east of England.
2. Far fewer people are dying on the roads
Despite people driving far more than in the post-war period, deaths on the road have declined since the mid-1960s.
Fatalities rose sharply as more people got cars in the 1950s and 60s, then fell dramatically.
The post-war peak was 1966, when 7,985 people died on the roads in England, Scotland and Wales.
From that year all new cars had to be fitted with seatbelts - though they only became compulsory in the front seat in 1983 and the back in 1991. These legal changes were accompanied by hard hitting advertising campaigns.
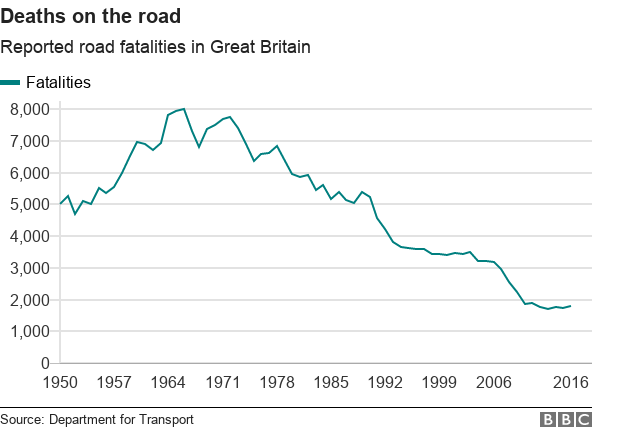
By 2010 the annual figure had fallen to about 1,800 and has stayed roughly there since, although there has been a small rise in some recent years.
The amount of traffic has grown hugely since the war, so road safety has improved even more dramatically than the total fatalities figure suggests.
This trend is replicated across the world. Prof Benjamin Heydecker of University College London says the improvements were not inevitable and have been brought about by the "three Es" of road safety policy: engineering, enforcement and education.
Between 2006 and 2010 there was a particularly sharp drop in deaths - 40%.
That's partly because traffic fell a bit during the financial crisis, as well as road engineering improvements and car safety. There's also been a rapid fall in the number of people killed in drink-driving incidents - from 490 in 2006 to 220 in 2010.
There are lots of other possible factors, says Heydecker, one being that young people - who are more likely to crash - increasingly interact by the internet and smart phones, making driving less essential.
3. Speed cameras have been linked to a fall in accidents
Speed cameras first started being used in 1992 but became widespread across the country in the early 2000s.
According to the Royal Society for the Prevention of Accidents they are a "very effective way of persuading drivers not to speed, and thereby reducing the number of people killed and seriously injured".
In 2016, about a quarter of all fatal accidents on the roads were related to speed.
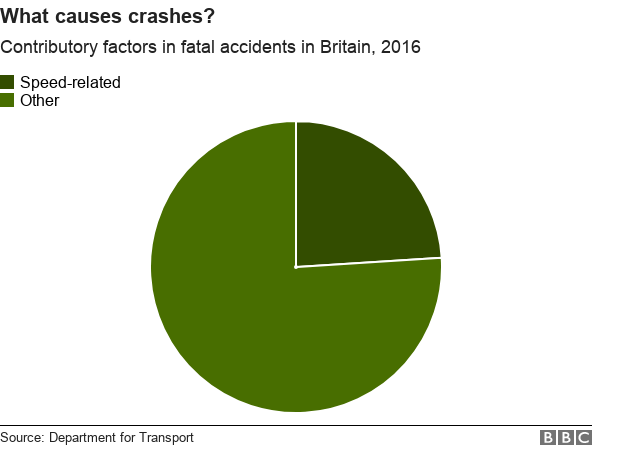
It was the third most common reason for fatal accidents, after drivers failing to look properly or losing control of their vehicles.
Other common factors contributing to accidents include:
Careless, reckless or aggressive driving
Driver impaired by alcohol or drugs
Fatigue
Driver failing to judge other person's path or speed
Research suggests an average of more than 400 deaths or serious injuries are prevented each year in Britain by the use of cameras, external. That's after you allow for the general decline in road accidents, and for natural variation.
On average the number of crashes resulting in death and serious injury was cut by more than a third in sites where speed cameras were installed.
Their effectiveness does vary though. The reduction in average speed at sites where speed cameras were installed ranges between 1% and 15%, while the reduction in the proportion of vehicles speeding ranges from 14% to 65%, again adjusting for the fact that not all decreases in injury or speed can be attributed to speed cameras. That's according to an international review published in 2010, external.
4. We're spending more than we used to on public transport
Most people spend far more on driving than they do on public transport. But the amount we spend on public transport has been increasing far more quickly in recent years.
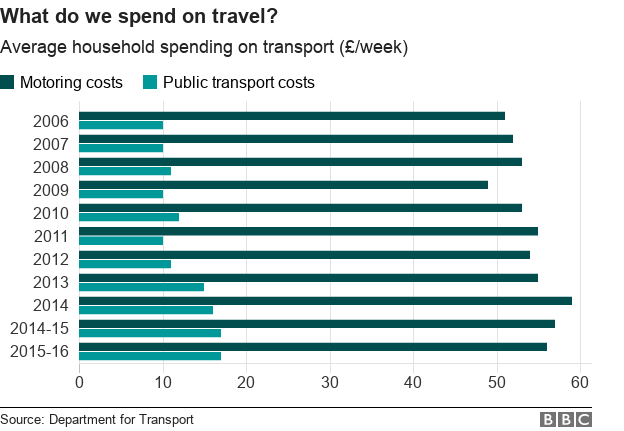
While spending on motoring has increased by 9% over the past decade, spending on public transport has increased by 74%.
That's partly because we're travelling far further by rail than a decade ago. It's also because fares are rising rapidly.
If you look at what's happened to motoring costs over the past two decades compared with the cost of public transport, driving costs have increased at a slower rate. That's using a Retail Price Index (RPI) measure of inflation to look at how the costs of driving and of public transport have increased relative to their 1997 levels.
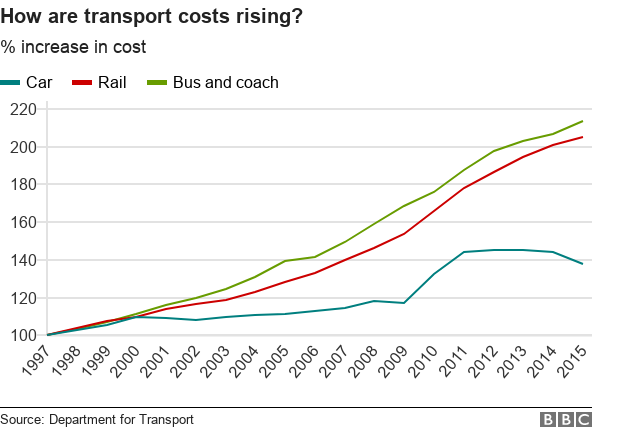
The average household still spends far more on driving than public transport though - £56.50 per week last year. Just under half this money went towards purchasing vehicles, while a slightly smaller chunk went on fuel. Most of the remaining cash went on spares, accessories, repairs and servicing.
The average household spent £17.20 a week on public transport last year - that's rail, underground, bus, coach and air travel combined.
Most of this - £11 per week - went on air travel, which is infrequent but expensive.
The average household spends less than £5 a week on rail fares and season tickets. This might surprise people living in London and the South East where this method of commuting is the norm - in much of the country it is a rarity.
5. Far more money is invested in London
Public money for transport is not distributed equally across the country.
Whether you look at the overall amount, or how much is spent per person, investment in London far outstrips other parts of the country.

This is slightly complicated by the fact that figures on spending per head are calculated based on how many people live in an area, not by how many people use the transport services.
In London, it may look like more is spent per person than the reality because the large commuter population who travel in by rail from outside the capital doesn't get included in the calculation.
The figures provide a snapshot of a single year so they can also be thrown off by a small number of large projects such as Crossrail or HS2.
But nevertheless, public spending on transport in London and the South East is much higher than in other places.
Scotland is comfortably in next place, which makes sense because it is far larger than Wales, Northern Ireland or any English region, and more sparsely populated.
Most other Department for Transport statistics only cover England, Wales and Scotland.
6. And more public money is spent on rail than roads
Although the vast majority of distance travelled in the UK is by road, more money is spent on rail than on national and local roads put together.
If you look at how much is spent for each kilometre travelled, public spending on rail is five to six times higher than spending on national roads, according to Paul Withrington, director of campaign group Transport Watch.
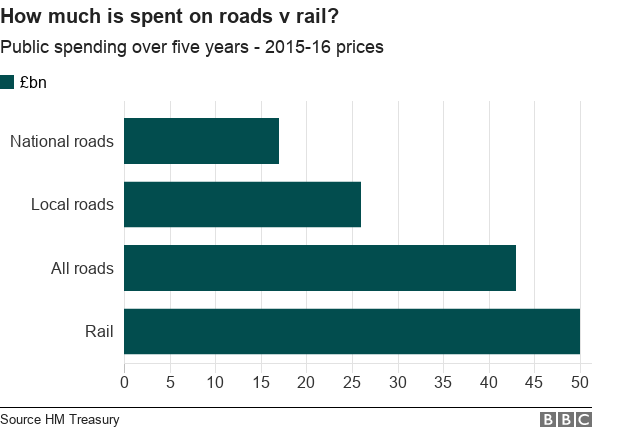
Maintaining the railways is by nature more expensive - there is a lot more infrastructure associated with rail and although they take up less land, they have to be much straighter and flatter than roads and so often involve expensive earthworks, bridges and tunnels.
And governments over the past decade or so have "have sought to curb private motoring in favour of rail" in order to cut carbon emissions, according to Prof Anthony Fowkes at the University of Leeds' Institute for Transport Studies.
However, these spending figures are a gross amount, meaning they don't include any money coming back to the government through ticket prices or tolls.
7. Most people own cars
The majority of households in England own at least one car these days, though about one in five households don't.
As you'd probably expect, it's the poorest in society who are least likely to own a car. If you look at the lowest income bracket, the proportion of households which don't own a car rises to 44%.
The proportion of households without a car fell dramatically from the middle of the 20th Century, but has been fairly stable for the last couple of decades.
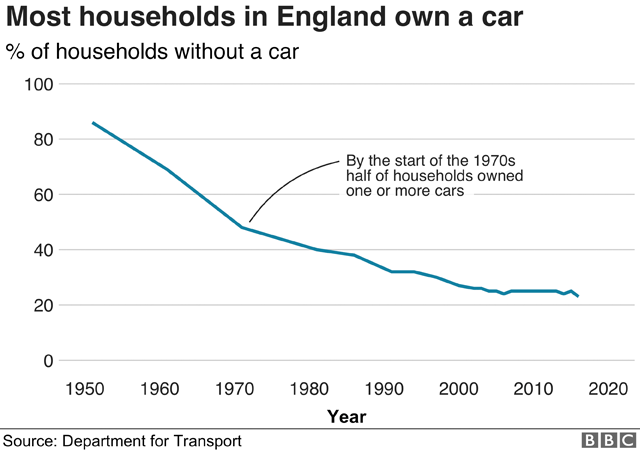
Although the overall proportion of people owning cars has remained fairly constant in recent years, this hides a significant change that has taken place among those who own cars, says Prof Heydecker.
Older women are far more likely to drive these days - there was a "societal shift" in the 1970s after which young women were far more likely to take up driving.
However, the proportion of young people overall who drive is falling - and a growing proportion of young people live in big cities, especially London, where cars are less essential.
Meanwhile, the proportion of households owning two or more cars has risen considerably. In 1981, 15% of households did. By 2016, a third had at least two vehicles at home.
8. Diesel's catching up with petrol - but maybe not for long
A couple of decades ago, the vast majority of vehicles on Britain's roads ran on petrol.
This began to change from the millennium. Labour Chancellor Gordon Brown introduced a lower vehicle tax for diesel cars in 2001 as they were thought to be more economical and less harmful in terms of carbon dioxide emissions.
Now the total number of diesel vehicles on the roads is not far off the number running on petrol.

Those powered by alternative fuels - like electric cars and hybrids - make up a tiny proportion. That's because of cost, range and "consumer perception", says Prof David Bailey of Aston University.
However, things are changing rapidly. There has been increasing concern that diesel cars emit dangerous levels of nitrogen dioxide, which is thought to contribute to thousands of premature deaths in the UK.
Diesel sales have fallen considerably over the past year.
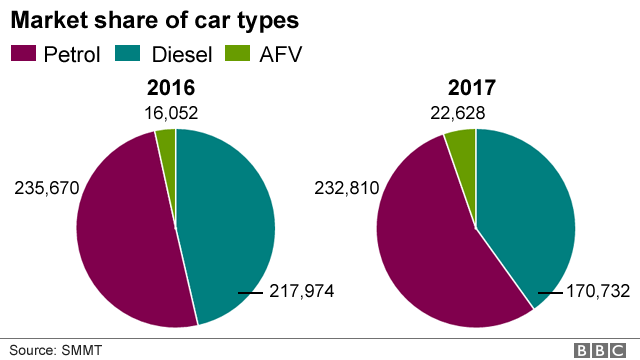
Vehicles running on alternative fuels form a small proportion of new sales but the figure is rising rapidly.
That trend is set to continue, says Prof Bailey. "There is likely to be a tipping point in the early to mid-2020s when the electric car outperforms the internal combustion engine car and we see mass take-up."
He also thinks hybrid vehicles will become mainstream in the coming years.
One big technological development could dramatically change the vehicle market in ways that are hard to predict - last month Chancellor Philip Hammond said driverless cars could be on UK roads as early as 2021.
9. And our petrol's cheaper than most of our European neighbours
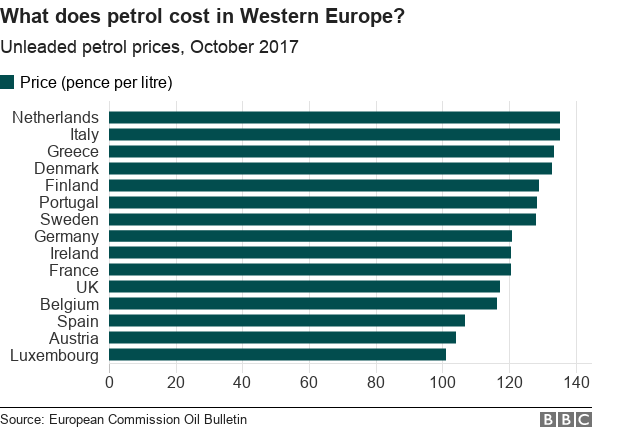
It might come as a surprise to British motorists, but petrol prices in the UK are among the cheapest in Western Europe.
Diesel prices, on the other hand, are relatively higher - only Swedes and Italians pay more.
Roughly the same amount is spent on the fuel itself in different European countries, says Simon Williams, the RAC's fuel spokesman.
But countries that pay a lot more than the UK at the pump like the Netherlands, Italy and Greece pay significantly more in taxes, while the "retailer margin" also varies a lot across the continent, he says.
Petrol and diesel cost roughly the same in the UK - in November the average was 120.2p a litre for petrol and 122.6p a litre for diesel, external, according to the AA motoring organisation.
Overall, fuel prices increased sharply between 2009 and 2012, the year they reached record highs. They have fallen quite a bit since then.
The price at the pump is determined by three things: global energy prices, tax, and the retailer's margin.
Global energy prices are volatile and unpredictable, and account for the big fluctuations over the past decade.
Taxes are set by governments. In the UK, fuel duty rose sharply in the 1990s, but at a slower rate since then. It was cut for several years from the early 2000s and has been frozen in cash terms since 2011.
10. But our traffic is worse
British roads are the most congested in Europe, a 2016 study of more than 100 cities suggests.
Data company Inrix found more than 20,000 so-called "traffic hotspots" in UK cities, well over double the number in Germany and eleven times the number in France.
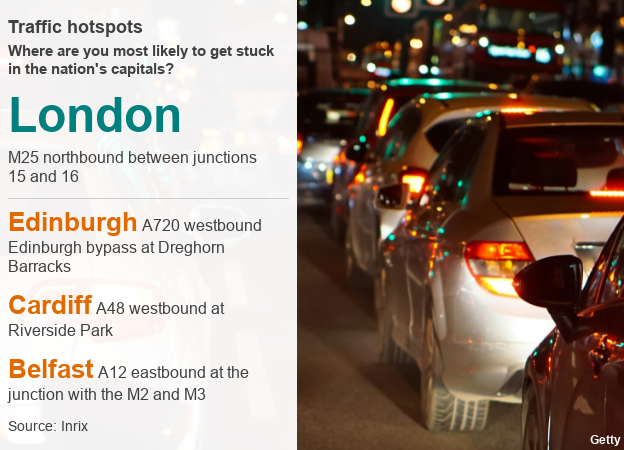
Some other congested UK cities and their worst hotspots include:
Glasgow: Eastbound junction of the A8 Glasgow and Edinburgh Road with the M8
Birmingham: Northbound junction of the A38 (M) with the M6
Manchester: M60 northbound at junction 1 for the A6 Stockport
Bristol: M5 southbound at junction 20 for Clevedon
Leeds: Westbound M62 junction 26 with M606 junction 1
Bradford: From the A650 in the city centre to the A6038 Otley Road
The government says it is investing £23bn between 2015 and 2020 to improve the roads and reduce congestion, describing this as "the biggest investment in a generation", as well as giving councils extra capital funding to upgrade roads and cut congestion.
- Published6 November 2017
- Published20 November 2017