Trains chaos: What's really going on?
- Published

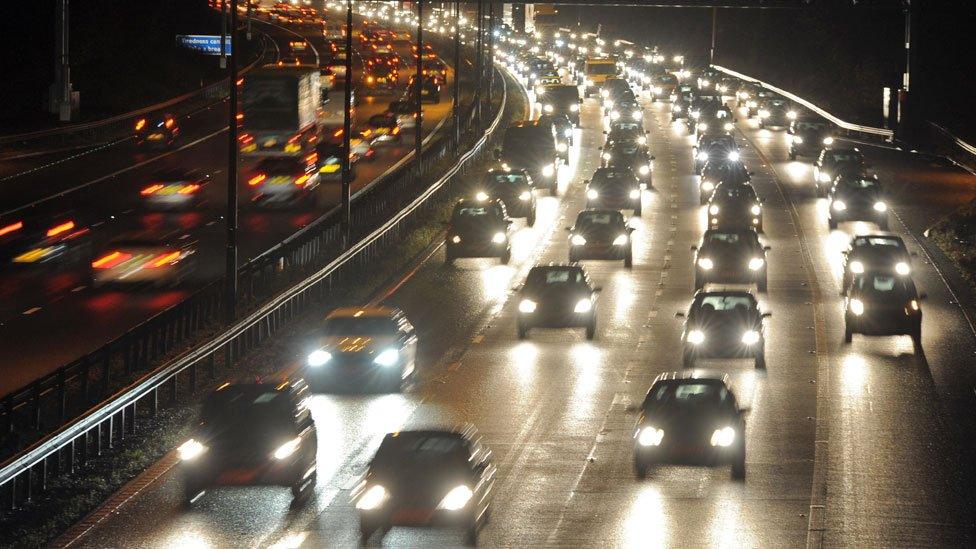
British commuters have faced cancellations and delays since a timetable change was introduced on 20 May.
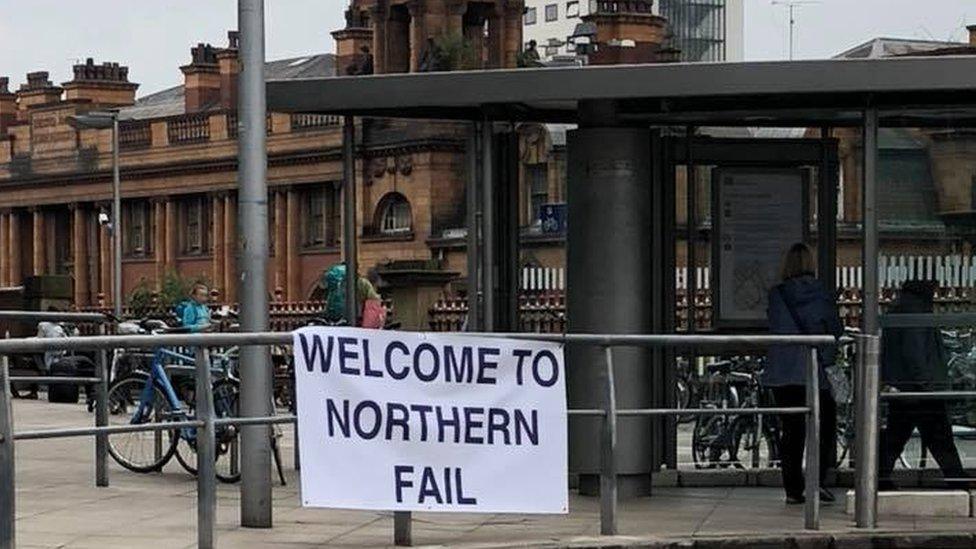
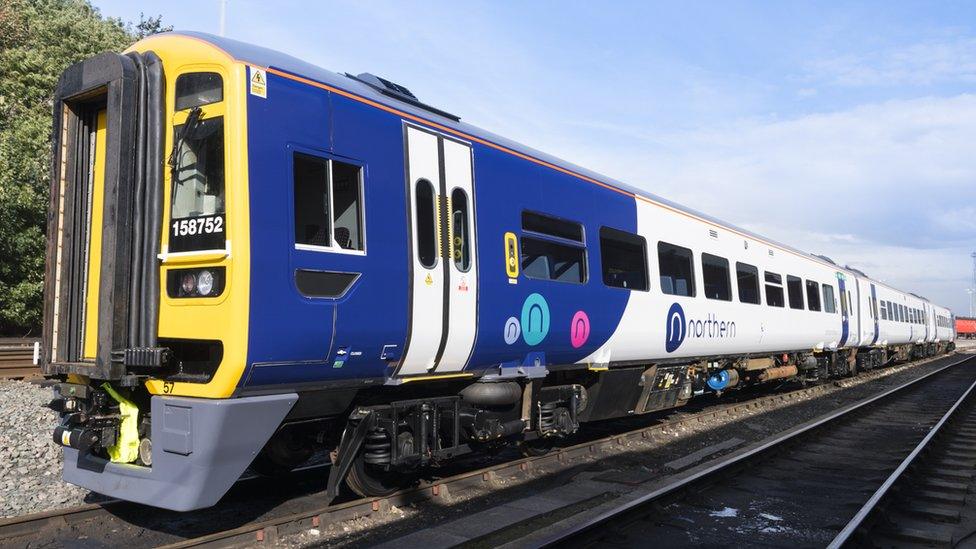
What was dubbed the "greatest timetable change for a generation" has left Northern and Govia Thameslink Railway customers facing travel disruption from London and the South East to Newcastle, Nottingham, Merseyside and Greater Manchester.
These charts explore the current state of rail travel in Great Britain.
1. The number of passengers is increasing
In 2016-17, 1.7 billion passengers travelled on the British train network, with journeys adding up to 65.8 billion kilometres.
Since 1994, the total number of passengers has increased by 135% - making trains a lot busier since privatisation.

Half of these journeys were on just four networks, primarily covering southern England:
Govia Thameslink Railway
South Western Railway
London Overground
Southeastern
2. Rail travel is most popular in southern England

A large proportion of train travel takes place in London and the south of England. But rail represents just 2.6% of all trips, according to the National Travel Survey.
Most journeys by English residents were by car (75.5%), walking (8.4%) or bus (7.2%).
3. Most trains arrive on time
One way to measure train performance is punctuality - the proportion of trains reaching their final destination on time.
Just under 90% of all trains arrived within five minutes of their scheduled times in the past year for London, the South East and regional services, or 10 minutes for long-distance operators.
But, a breakdown by franchise can shed light on why some passengers might be more upset than others.

Govia Thameslink Railway, the company that owns Southern Rail, and Virgin East Coast Main Line saw nearly 20% of their trains delayed.
4. Train cancellations are relatively low
Focusing on cancellations and severe delays (more than 30 minutes) brings up similar results.

Once again, First Hull Trains is the worst performing train operating company.
This might be explained by its size. With just one million passengers last year, it is one of the smallest in Great Britain. That means a few cancellations could disproportionately affect its statistics.
In comparison, Govia Thameslink Railway has more than 320 million annual passengers.
With 6% of trains cancelled or severely delayed, the scale of disruption would be far greater.
5. Overall, prices have decreased
The average price for a train journey (taking inflation as measured by the retail price index into account) has gradually gone down since 1999.
From 1999 to 2016, the average price paid per single journey decreased from £5.79 to £5.46. Prices peaked in 2008 at £6.04, according to the Rail Delivery Group.

This covers journeys made on rail franchises in Great Britain - excluding the London Underground and open-access operators such as Grand Central or First Hull Trains. Open-access operators don't receive subsidy from, or pay any premium to, the Department for Transport.
Last month, the Rail Delivery Group, which represents all rail companies, launched a public consultation on fares in the UK.
It says about 55 million different fares exist in the current system, so customers aren't always offered the cheapest available.
6. How much does the government spend on rail?
In 2016-17, the UK rail industry generated £19bn in income.
About half of that was generated by passengers. Passenger fares accounted for £9.7bn, while on-train catering and car parking generated £0.8bn.

Income from passengers increased by 1.1% on the year before. According to the Office of Rail and Road, external (ORR), this was due to a combination of more journeys and higher fares.
Overall, the industry received 21% of its total income from the government. The ORR said that this funding was a mixture of grants for the government-owned Network Rail, support for franchises and the rail freight industry.
The biggest item of expenditure in 2016-17 was operating services. Train operators spent £11.3bn on costs such as staff salaries and rolling stock, as well as payments to the Department for Transport.
7. Which stations are the busiest?
More than one million passengers departed from London train stations on the average autumn weekday in 2016, according to the Department for Transport, external.

Birmingham and Manchester followed, with more than 123,012 and 99,019 departures.
Waterloo was the busiest station in the English capital in 2016, when 218,000 passengers departed from the station on a typical autumn weekday.
Next in line were Victoria and St Pancras International at 197,000 and 131,000 passengers.


- Published1 June 2018
- Published25 May 2018
- Published22 December 2017