BBC Homepage
  • Skip to content
  • Accessibility Help
  • Your account
  • Notifications
  • Home
  • News
  • Sport
  • Weather
  • iPlayer
  • Sounds
  • Bitesize
  • CBBC
  • CBeebies
  • Food
  • More menu
More menu
Search BBC
  • Home
  • News
  • Sport
  • Weather
  • iPlayer
  • Sounds
  • Bitesize
  • CBBC
  • CBeebies
  • Food
Close menu
BBC News
Menu
  • Home
  • InDepth
  • Israel-Gaza war
  • War in Ukraine
  • Climate
  • UK
  • World
  • Business
  • Politics
  • Culture
More
  • Tech
  • Science
  • Health
  • Family & Education
  • In Pictures
  • Newsbeat
  • BBC Verify
  • Disability
  • UK
  • England
  • N. Ireland
  • Scotland
  • Alba
  • Wales
  • Cymru
  • Isle of Man
  • Guernsey
  • Jersey
  • Local News

Check your postcode: Is your area vulnerable to extreme heat?

  • Published
    20 July 2022
Share page
About sharing
Related topics
  • UK heatwaves
City skyline with buildings in red and trees in blue

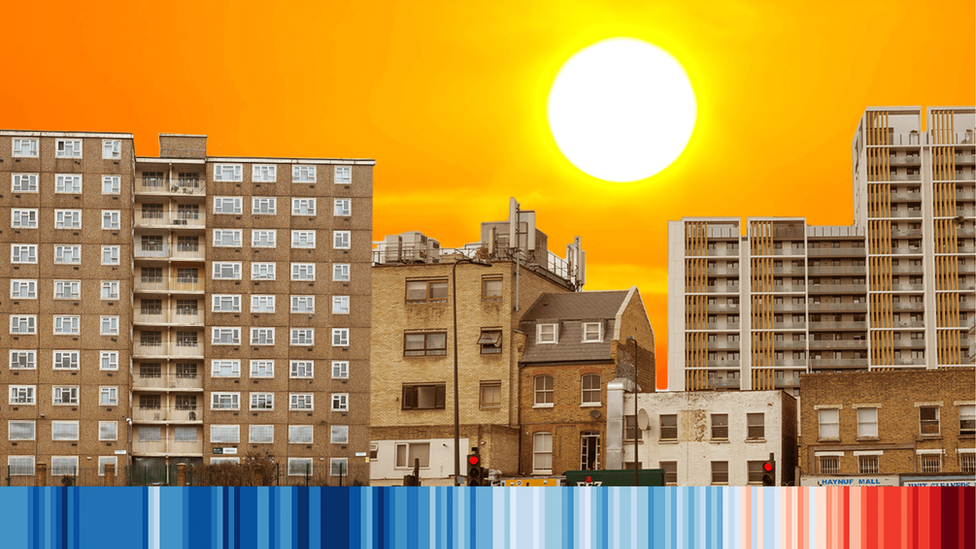
Rising summer temperatures are causing longer and more frequent heatwaves across Great Britain, according to the Met office.

BBC analysis estimates that six million people live in places at risk of higher heat during the summer months.

Using satellite data from 4 Earth Intelligence, the BBC mapped how vulnerable postcode areas were to extreme heat in England, Wales and Scotland during periods of hot weather over the past three summers - shown with a heat hazard score.

A modern browser with JavaScript and a stable internet connection is required to view this interactive.

Is your postcode area vulnerable to extreme heat?

Enter your full postcode to find out

Find out more about the data

The heat hazard score for each postcode area was calculated by 4 Earth Intelligence (a satellite analytics company), who measured the average land surface temperature over a sample of days across the past three summers in Great Britain.

Each heat hazard score represents different sized groups, as shown in the scale. This is to highlight the places where the temperature in an area was higher compared to the rest of Great Britain, once the temperature had been adjusted to make it comparable across regions.

For example, a score of one means the postcode was in the lowest 40% of potential heat hazard areas, while a score of five means it was in the top 1% of potential heat hazard areas.

If your postcode is represented by or contains a small square, this may be because your building has too many addresses in it for a single postcode. This block can be shown adjacent to areas with the same postcode, or a few streets away.

If you can't view the postcode lookup, click here.

The difference in heat between areas is often due to a phenomenon known as the urban heat island effect, where buildings and roads absorb and retain heat and become significantly hotter than surrounding areas with shade or green space.

This can be seen in part of Brent, London, seen below. Postcodes next to or near green spaces, such as Roundwood Park, are generally cooler than those surrounded by other buildings over the past three summers, according to the data from 4 Earth Intelligence.

Map showing heat hazard areas in Brent, with areas near green spaces showing a lower hazard score

A similar effect can be seen with bodies of water in Cardiff Bay. One of the postcodes below, which includes buildings next to the River Taff and a wildlife reserve, are cooler than those in more built up areas nearby.

Map showing heat hazard areas in Cardiff, with areas near water showing a lower hazard score
line

About the data

Where is the data from?

The potential heat hazard score for each postcode area was calculated by 4EI, who measured the average land surface temperature over a sample of days in the past three summers across Britain.

What does my heat hazard score mean?

Each score, ranging from one to five, is an indicator of how likely it is that your area will experience high temperatures during hot weather, when compared with other areas in your surrounding neighbourhood.

How was the score calculated?

A statistical method published by academics was used to standardise land surface temperatures for each postcode area, which involved combining satellite images for different dates over the past three years.

The temperature data was then adjusted to consider the different average temperatures of each region, to highlight hotter areas across the country, despite varying climates and temperatures.

Each heat hazard score represents different sized groups, as described below.

1 = 40th percentile and lower, if you lined up all the postcodes by heat hazard score, your postcode is in the coolest 40%.

2 = 40th - 70th percentile, your postcode is in the mid-range. 40% of postcodes have a lower heat hazard than yours but 30% have a higher one.

3 = 70th - 90th percentile, your postcode is towards the upper end of the scale. 70% of postcodes have a lower heat hazard than than yours but 10% have a higher one.

4 = 90th - 99th percentile, nine out of 10 postcodes have a lower heat hazard than yours and only 1% have a higher one.

5 = 99th percentile, your postcode area has among the highest heat hazard scores.

Why does my postcode show a square block?

A single building can contain more than one postcode, such as a block of flats, this is known as a vertical street.

On the heat hazard map, postcodes that are part of vertical streets are represented by a square shape.

Vertical street postcodes which sit away from the main postcode area, or inside other postcode areas have inherited the heat hazard score from the main postcode they originally belong to.

I live in Didcot or Northampton, why is there no data for my area?

Postcodes in Didcot and Northampton do not have a heat hazard score. This is because of limitations in the way the satellite data was collected which meant scores for neighbourhoods in these areas were not comparable to one another.

Produced by Rob England, Harriet Bradshaw, Libby Rogers, Jana Tauschinski, Deirdre Finnerty and Wesley Stephenson. Development by Alexander Ivanov, Marcos Gurgel, Shilpa Saraf and Becky Rush. Data provided by 4 Earth Intelligence.

Related topics

  • Wales
  • Economic inequality
  • Scotland
  • England
  • UK heatwaves
  • Climate
  • Heatwaves

More on this story

  • Busiest day since WW2 for London firefighters

    • Published
      20 July 2022
    A man in high-vis walks past the ruins of a house at the scene after a blaze in the village of Wennington, east London
  • Wildfires rage as heatwave moves across Europe

    • Published
      20 July 2022
    A firefighting helicopter tries to extinguish a wildfire threatening houses at the north-east suburb of Pallini, near Athens, Greece, 20 July 2022.
  • Fires blaze after UK passes 40C for first time

    • Published
      19 July 2022
    Firefighters at the scene of a blaze in the village of Wennington, east London
  • ‘It’s like an oven’: Life in Britain’s hottest areas

    • Published
      18 July 2022
    A street with lots of high rise buildings with a strong orange sun in the background
  • Four ways climate change worsens extreme weather

    A sombre-looking middle-aged woman covered in mud walks down a flooded street in Valencia which is filled with damaged furniture, kitchen appliances and other household goods after heavy rain and flooding hit large parts of Spain on 2 November, 2024. To the right of the image is A badly-damaged car with no windows.

Top stories

  • Live. 

    Illegal migration 'dividing our country', home secretary says ahead of asylum policy shake-up

    • 3306 viewing3.3k viewing
  • Feud erupts between Trump and ally Marjorie Taylor Greene ahead of Epstein files vote

    • Published
      3 hours ago
  • Arctic blast to move across UK as flood clean up continues

    • Published
      13 minutes ago

More to explore

  • He takes medical cannabis every day - but worries people think he's a lazy stoner

    A man with short brown hair and light stubble looks at the camera. Behind him are a row of terraced houses and a Welsh flag.
  • End of 'golden ticket' asylum rules and Labour leadership talk

    The Sunday Times and Sunday Telegraph front pages
  • My mum was a 17-year-old free spirit - so she was locked up and put in a coma

    Mariona and her daughter Marina on a Barcelona street
  • Bin bags are piling up on this street - residents have had enough

    A row of clear plastic rubbish bags stacked up and filled with mixed household waste, including cardboard boxes, food containers, and plastic bottles, lined up on a pavement in front of a brick building with two white-framed windows and metal security bars.
  • Why India caps pollution reading at 500 when the air is far more toxic

    Smog engulfing railway tracks in Delhi on 13 November 2025 in New Delhi, India, as a woman wearing a red Indian outfit, with her head covered walks by.
  • Retirement? World title shot? What next for Eubank and Benn?

    • Attribution
      Sport
    Chris Eubank Jr and Conor Benn face off before their rematch
  • 'Head in hands': Ministers fume at No 10's self-inflicted chaos

    A treated image of Sir Keir Starmer and Rachel Reeves
  • Epstein files: Who else was mentioned?

    Former Treasury Secretary Larry Summers (left), Former White House counsel Kathryn Ruemmler (centre) and journalist Michael Wolff (right)
  • Off Air with Laura K: Get Laura Kuenssberg’s weekly newsletter emailed directly to you

    Laura Kuenssberg
loading elsewhere stories

Most read

  1. 1

    Feud erupts between Trump and ally Marjorie Taylor Greene ahead of Epstein files vote

  2. 2

    Data centre in the shed reduces energy bills to £40

  3. 3

    My mum was a 17-year-old free spirit - so she was locked up and put in a coma

  4. 4

    Major incident still in place after Storm Claudia causes severe flooding

  5. 5

    All you need to know as I’m a Celebrity 2025 kicks off

  6. 6

    Match abandoned after 'sexist' abuse of referee

  7. 7

    Bin bags are piling up on this street - residents have had enough

  8. 8

    He takes medical cannabis every day - but worries people think he's a lazy stoner

  9. 9

    Fuelled by fear, Benn ends 35-year wait for revenge

    • Attribution
      Sport
  10. 10

    Chance meeting at corner shop unites son with father

BBC News Services

  • On your mobile
  • On smart speakers
  • Get news alerts
  • Contact BBC News

Best of the BBC

  • Preview the return of Daddy Issues

    • Attribution
      iPlayer

    Added to Watchlist
    Daddy Issues has been added to your iPlayer Watchlist.
    Daddy Issues
  • Sex Pistols: The fights, the scandals and the enduring legacy

    • Attribution
      Sounds

    Added to My Sounds
    The Rise and Fall of ... has been added to your My Sounds.
    The Rise and Fall of: Sex Pistols
  • Antiques experts head on a UK road trip

    • Attribution
      iPlayer

    Added to Watchlist
    Antiques Road Trip has been added to your iPlayer Watchlist.
    Antiques Road Trip
  • Could we be heading for an AI crash?

    • Attribution
      Sounds

    Added to My Sounds
    Business Daily has been added to your My Sounds.
    Business Daily: AI Bubble
  • Home
  • News
  • Sport
  • Weather
  • iPlayer
  • Sounds
  • Bitesize
  • CBBC
  • CBeebies
  • Food
  • Terms of Use
  • About the BBC
  • Privacy Policy
  • Cookies
  • Accessibility Help
  • Parental Guidance
  • Contact the BBC
  • Make an editorial complaint
  • BBC emails for you

Copyright © 2025 BBC. The BBC is not responsible for the content of external sites. Read about our approach to external linking.