How cuts changed council spending, in seven charts
- Published

It's widely known that since 2010, English councils have had less money to spend. But that's just half the story.
When you account for inflation - or how much more expensive everything else is getting - some councils have had to cut some areas of their spending by half.
Housing and planning budgets have been particularly hit, with only children's social care seeing rising spending.
In the charts below, we explore where taxpayers' money has gone since austerity began.
1. Councils spend most of their money on education
Councils vary massively in size, both in spending and the number of people they serve. However, across England, councils spent about £77bn providing services, excluding funding for fire authorities and police commissioners. That's about £1,378 per person, per year.
By far the biggest share goes on education: about £580 per person, per year. That includes teachers' salaries and supplies at primary and secondary schools.
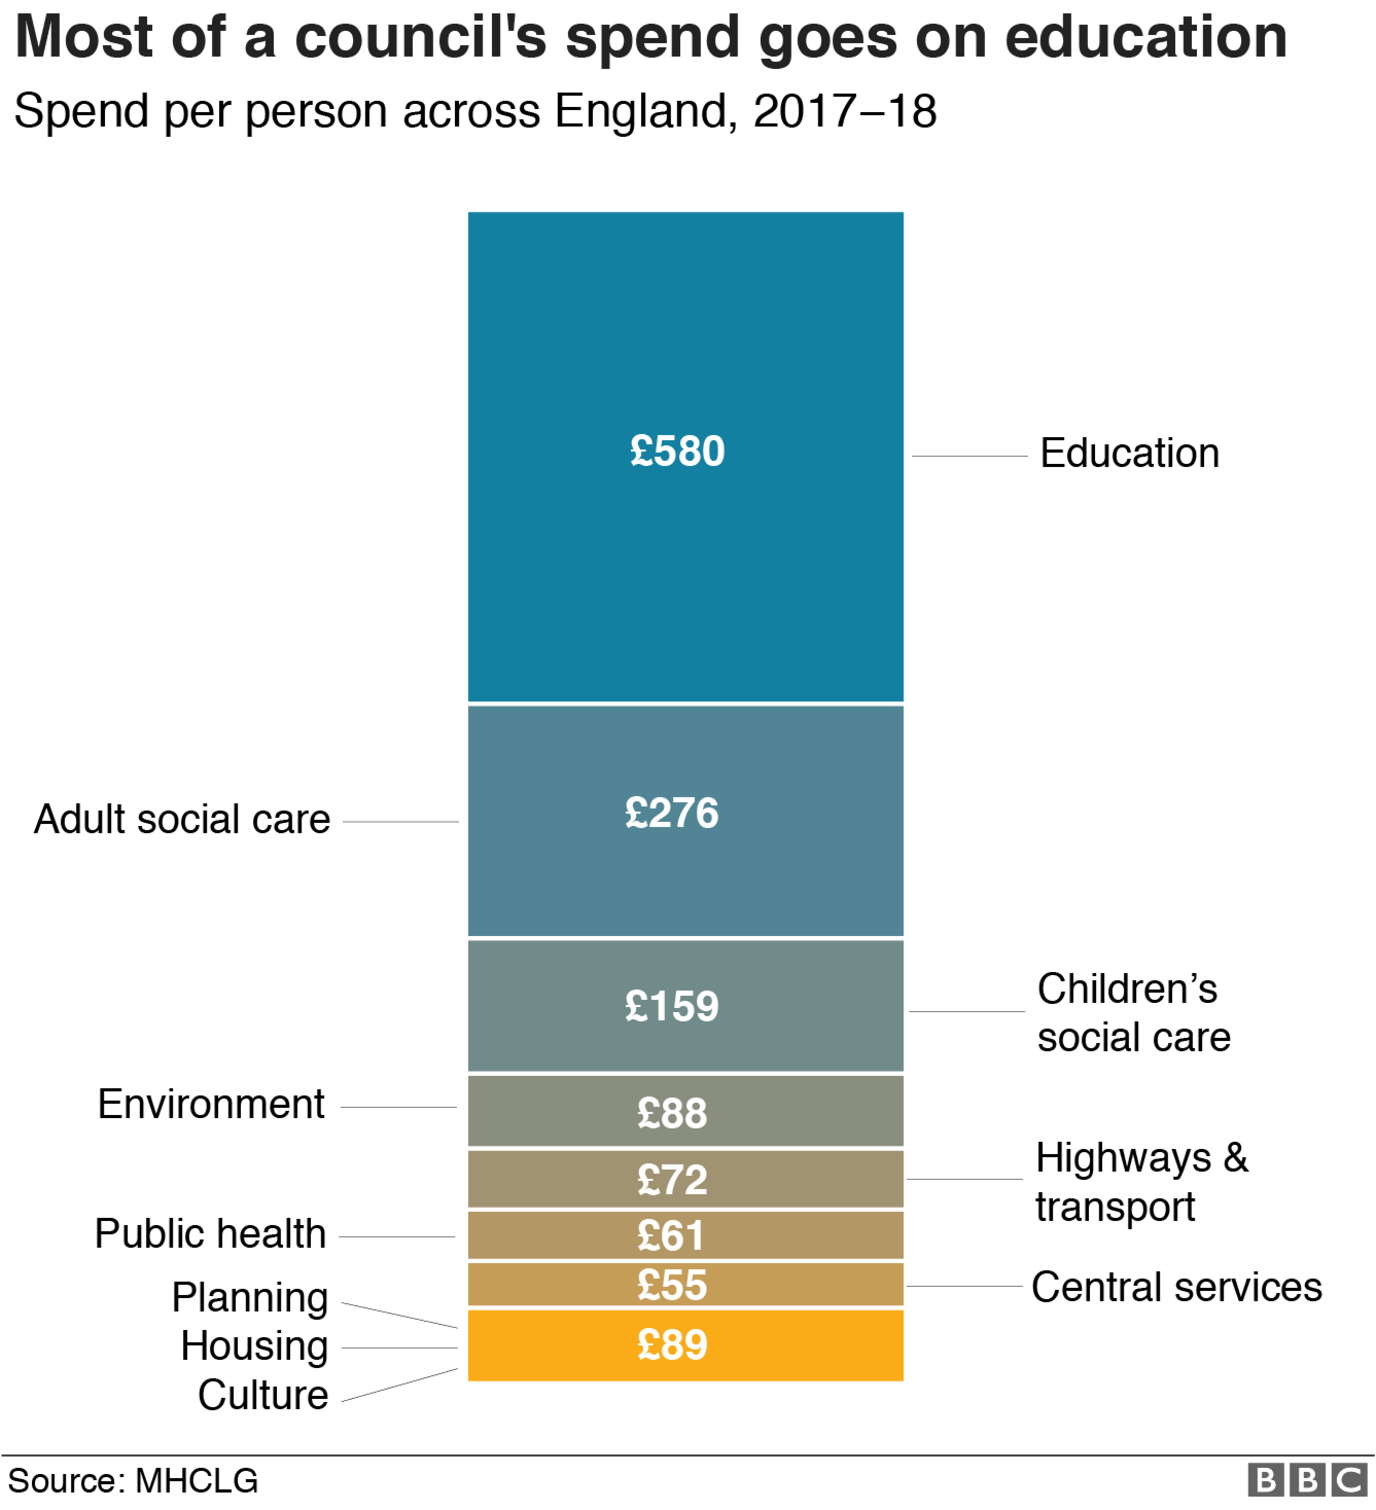

The next largest categories - adult and children's social care - include offering physical support, help for people with learning disabilities and social support for adults as well as safeguarding young people, youth justice and family support services for children.
Environment includes what people commonly associate with councils: bins, public toilets and CCTV cameras. Highways and transport includes parking and road maintenance, while central services refers to things such as council tax collection and running elections.
Planning, which involves scrutinising what is allowed to be built, housing, which includes homelessness support and administering housing benefits, and culture - including libraries and museums - make up the rest of council spending.
Furthermore, councils have had control of public health since 2013, when primary care trusts were abolished. Since then, councils have received grants from the government to fund it.
2. Spending has fallen in all areas but children's social care
When you factor in inflation and population growth, council spending per person has fallen 30% in real terms. But it's areas such as housing, culture and planning that have suffered the biggest cuts.
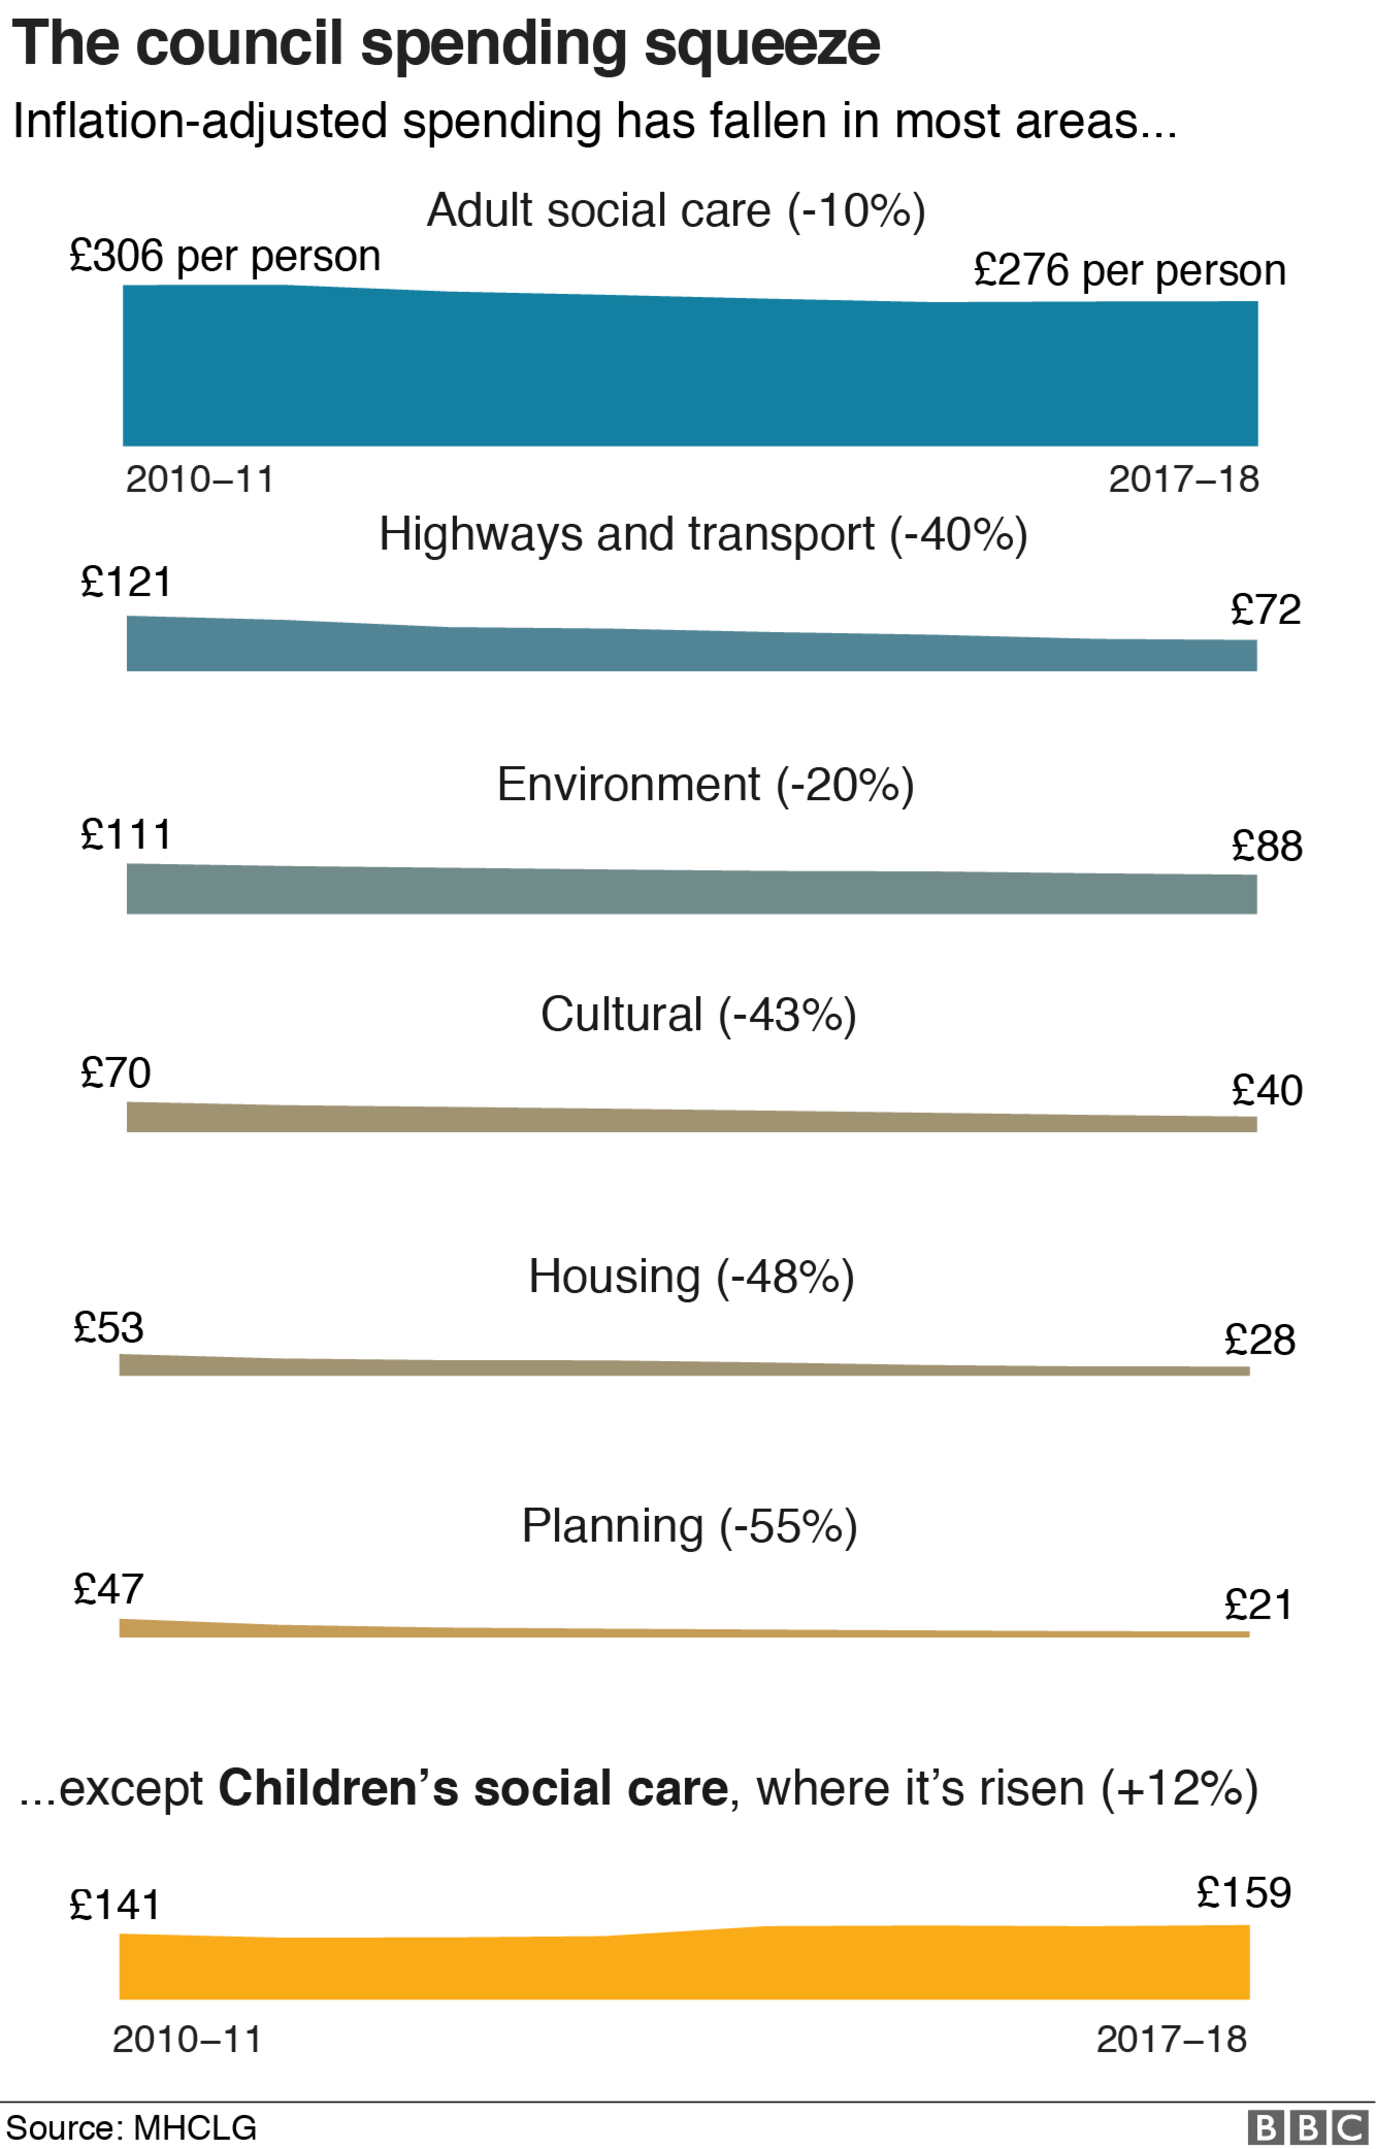

Only spending on children's services has avoided being cut in real terms since 2010-11. This is largely because of a rise in the number of children needing protection, meaning councils are having to put more of their dwindling budgets into investigating concerns and taking action. There have also been some accounting changes, with services for young people moving from education to children's social care.
As of 31 March 2018, there were 75,240 children being looked after by local authorities in England. This compares with 68,810 in 2014.
Kathy Evans, chief executive of charities group Children England, said: "There are more children being taken into care by councils now than there have been since the 1980s but the council budgets that have to pay for the costs of their care are so strained in meeting daily costs that there is no money to invest in the new 'additional' care capacity needed to meet the needs of the growing care population."
3. As a result, 33p in every pound of spending on services goes on social care
A third of what English councils spend on providing services now goes on social care, compared with just under a quarter at the start of the decade.
This excludes spending on public health, which councils took responsibility for in 2013.
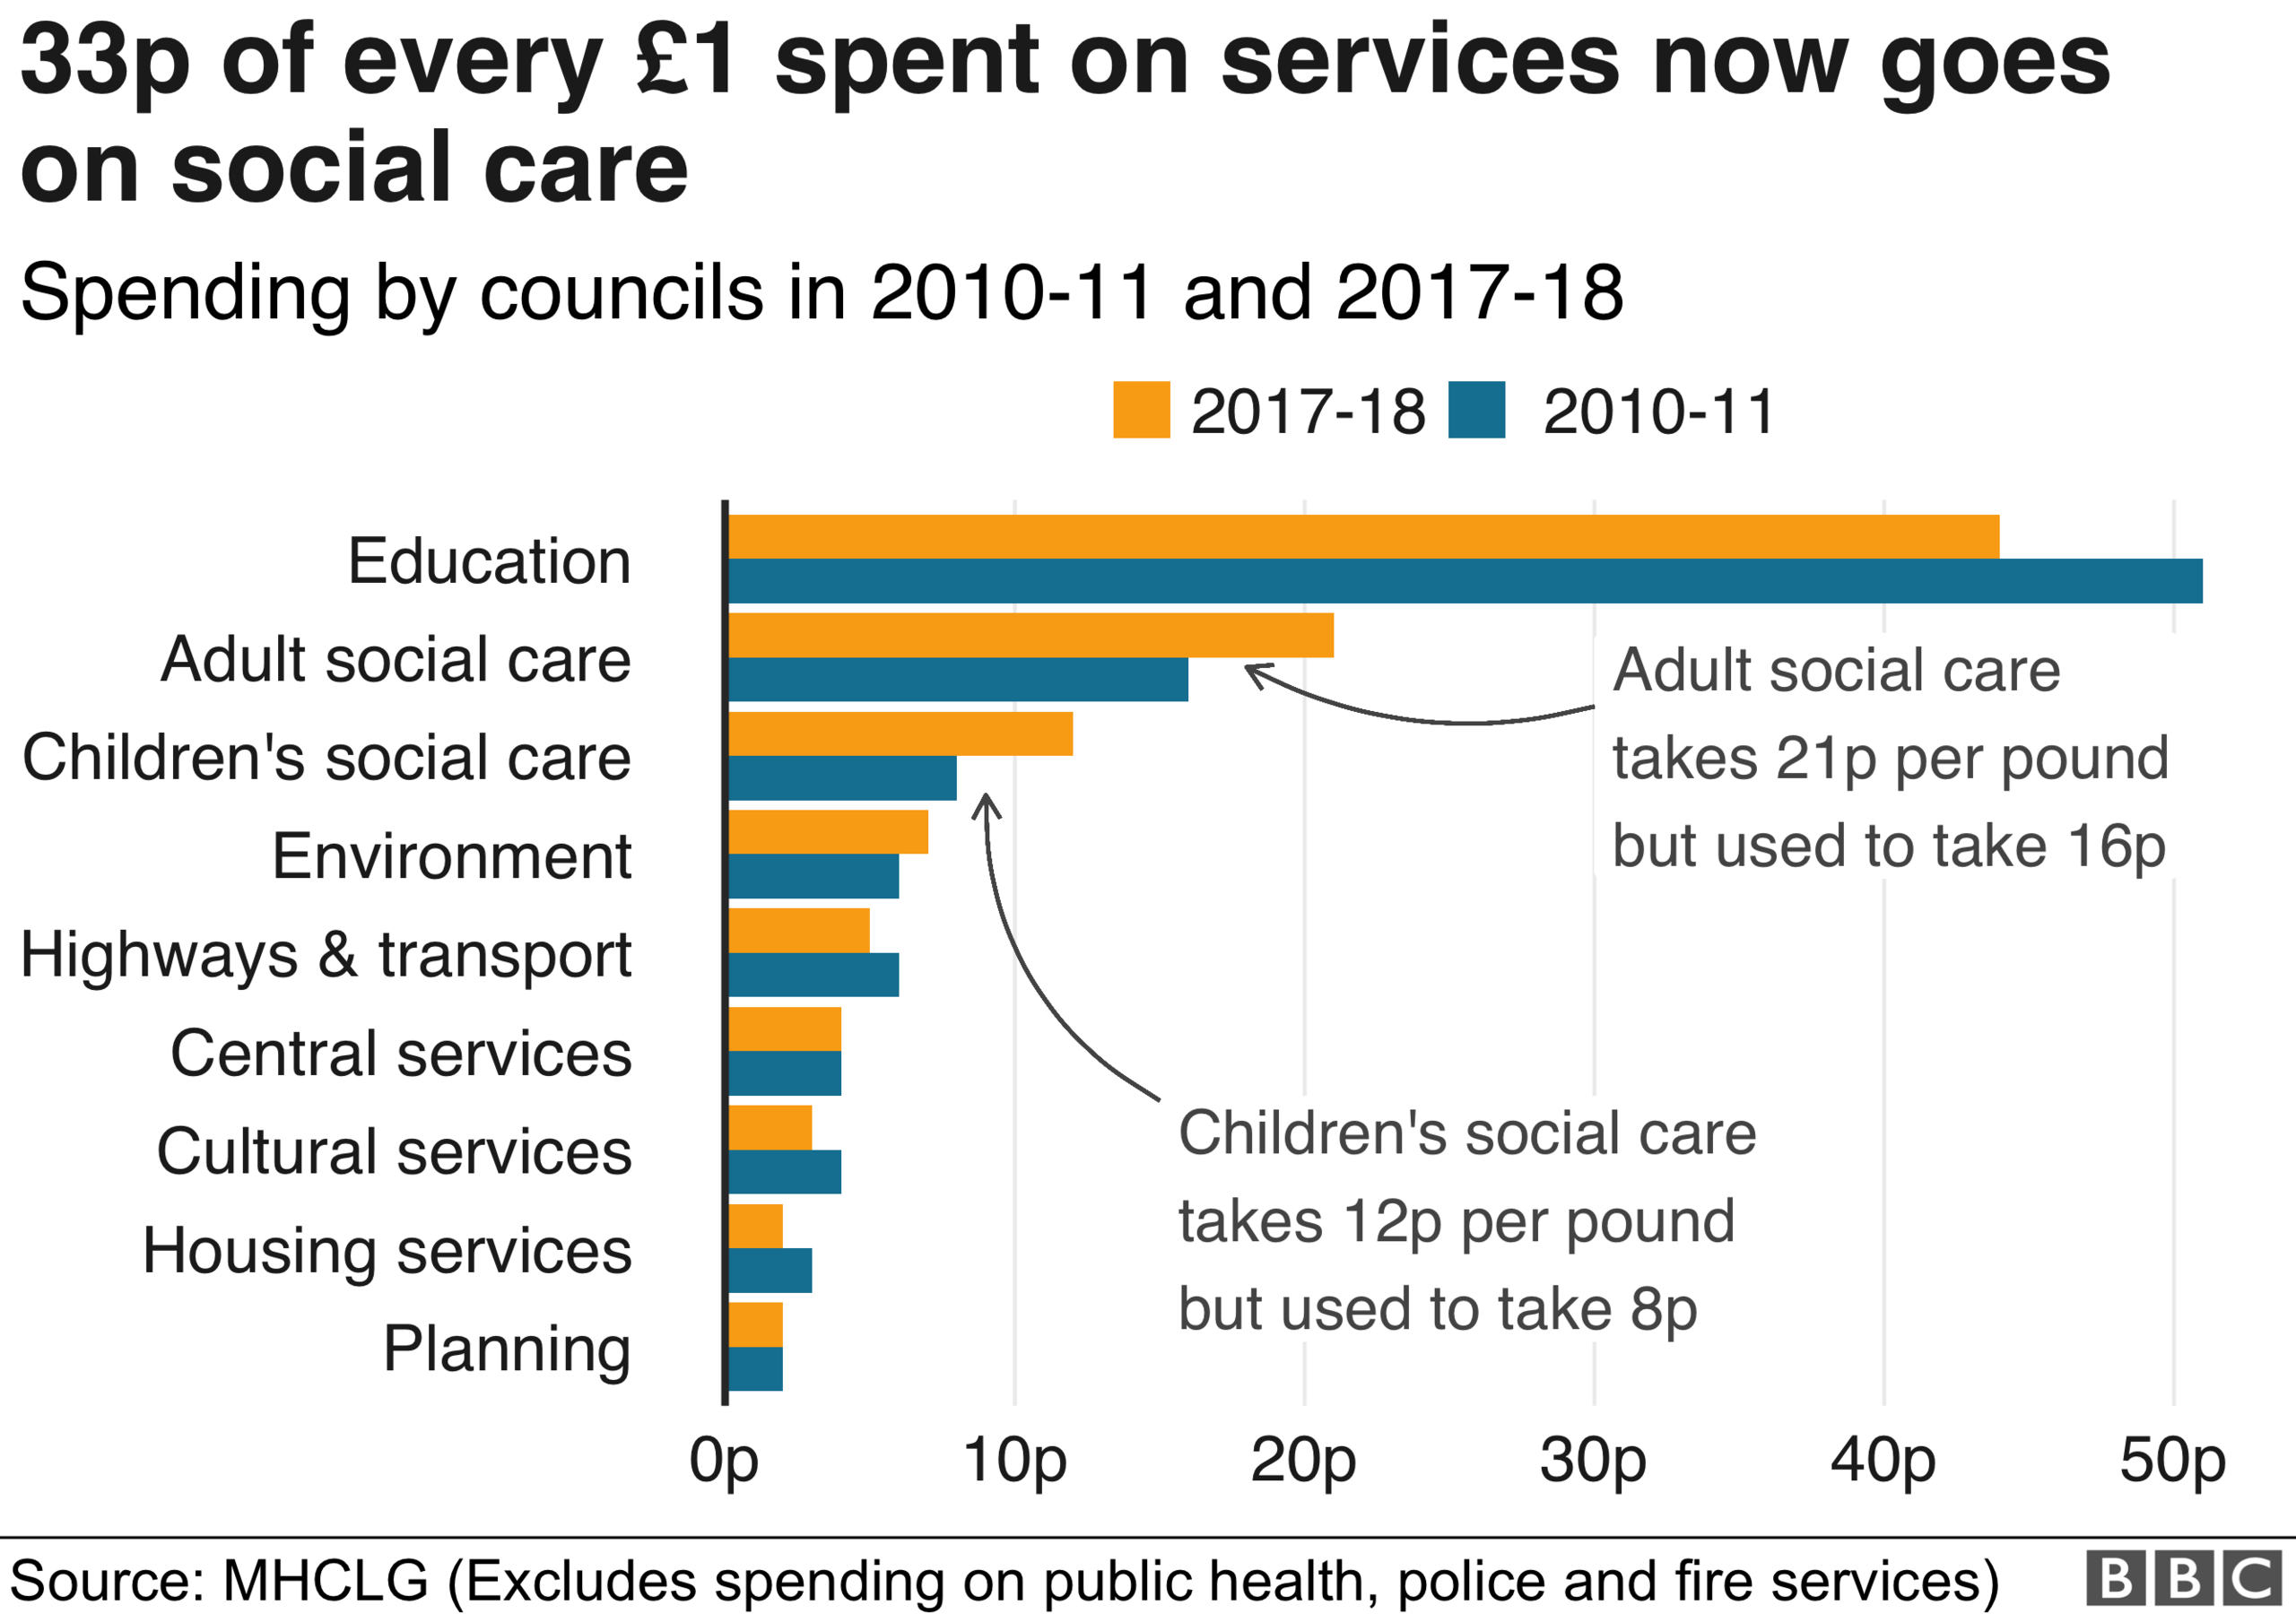
Education takes up a smaller proportion of council spending due to the growth of academies, which get their funding from central government rather than via councils and because young people's services were transferred from the education budget to children's social care.
Adult social care, which now takes up 21p in every pound spent on services, is seen as the "biggest pressure" for local authorities, according to the County Councils Network.
Councils now pay for support for people with learning disabilities, which used to be funded by the NHS.
However, even this area of spending has fallen when inflation is taken into account.
It would have fallen further had it not been for a change introduced by the government in 2015, which gave councils the power to increase council tax by an extra 2% to pay for social care for adults. For the following two years, they were allowed to raise the tax by an extra 3%.
4. But we were paying less council tax since 2010
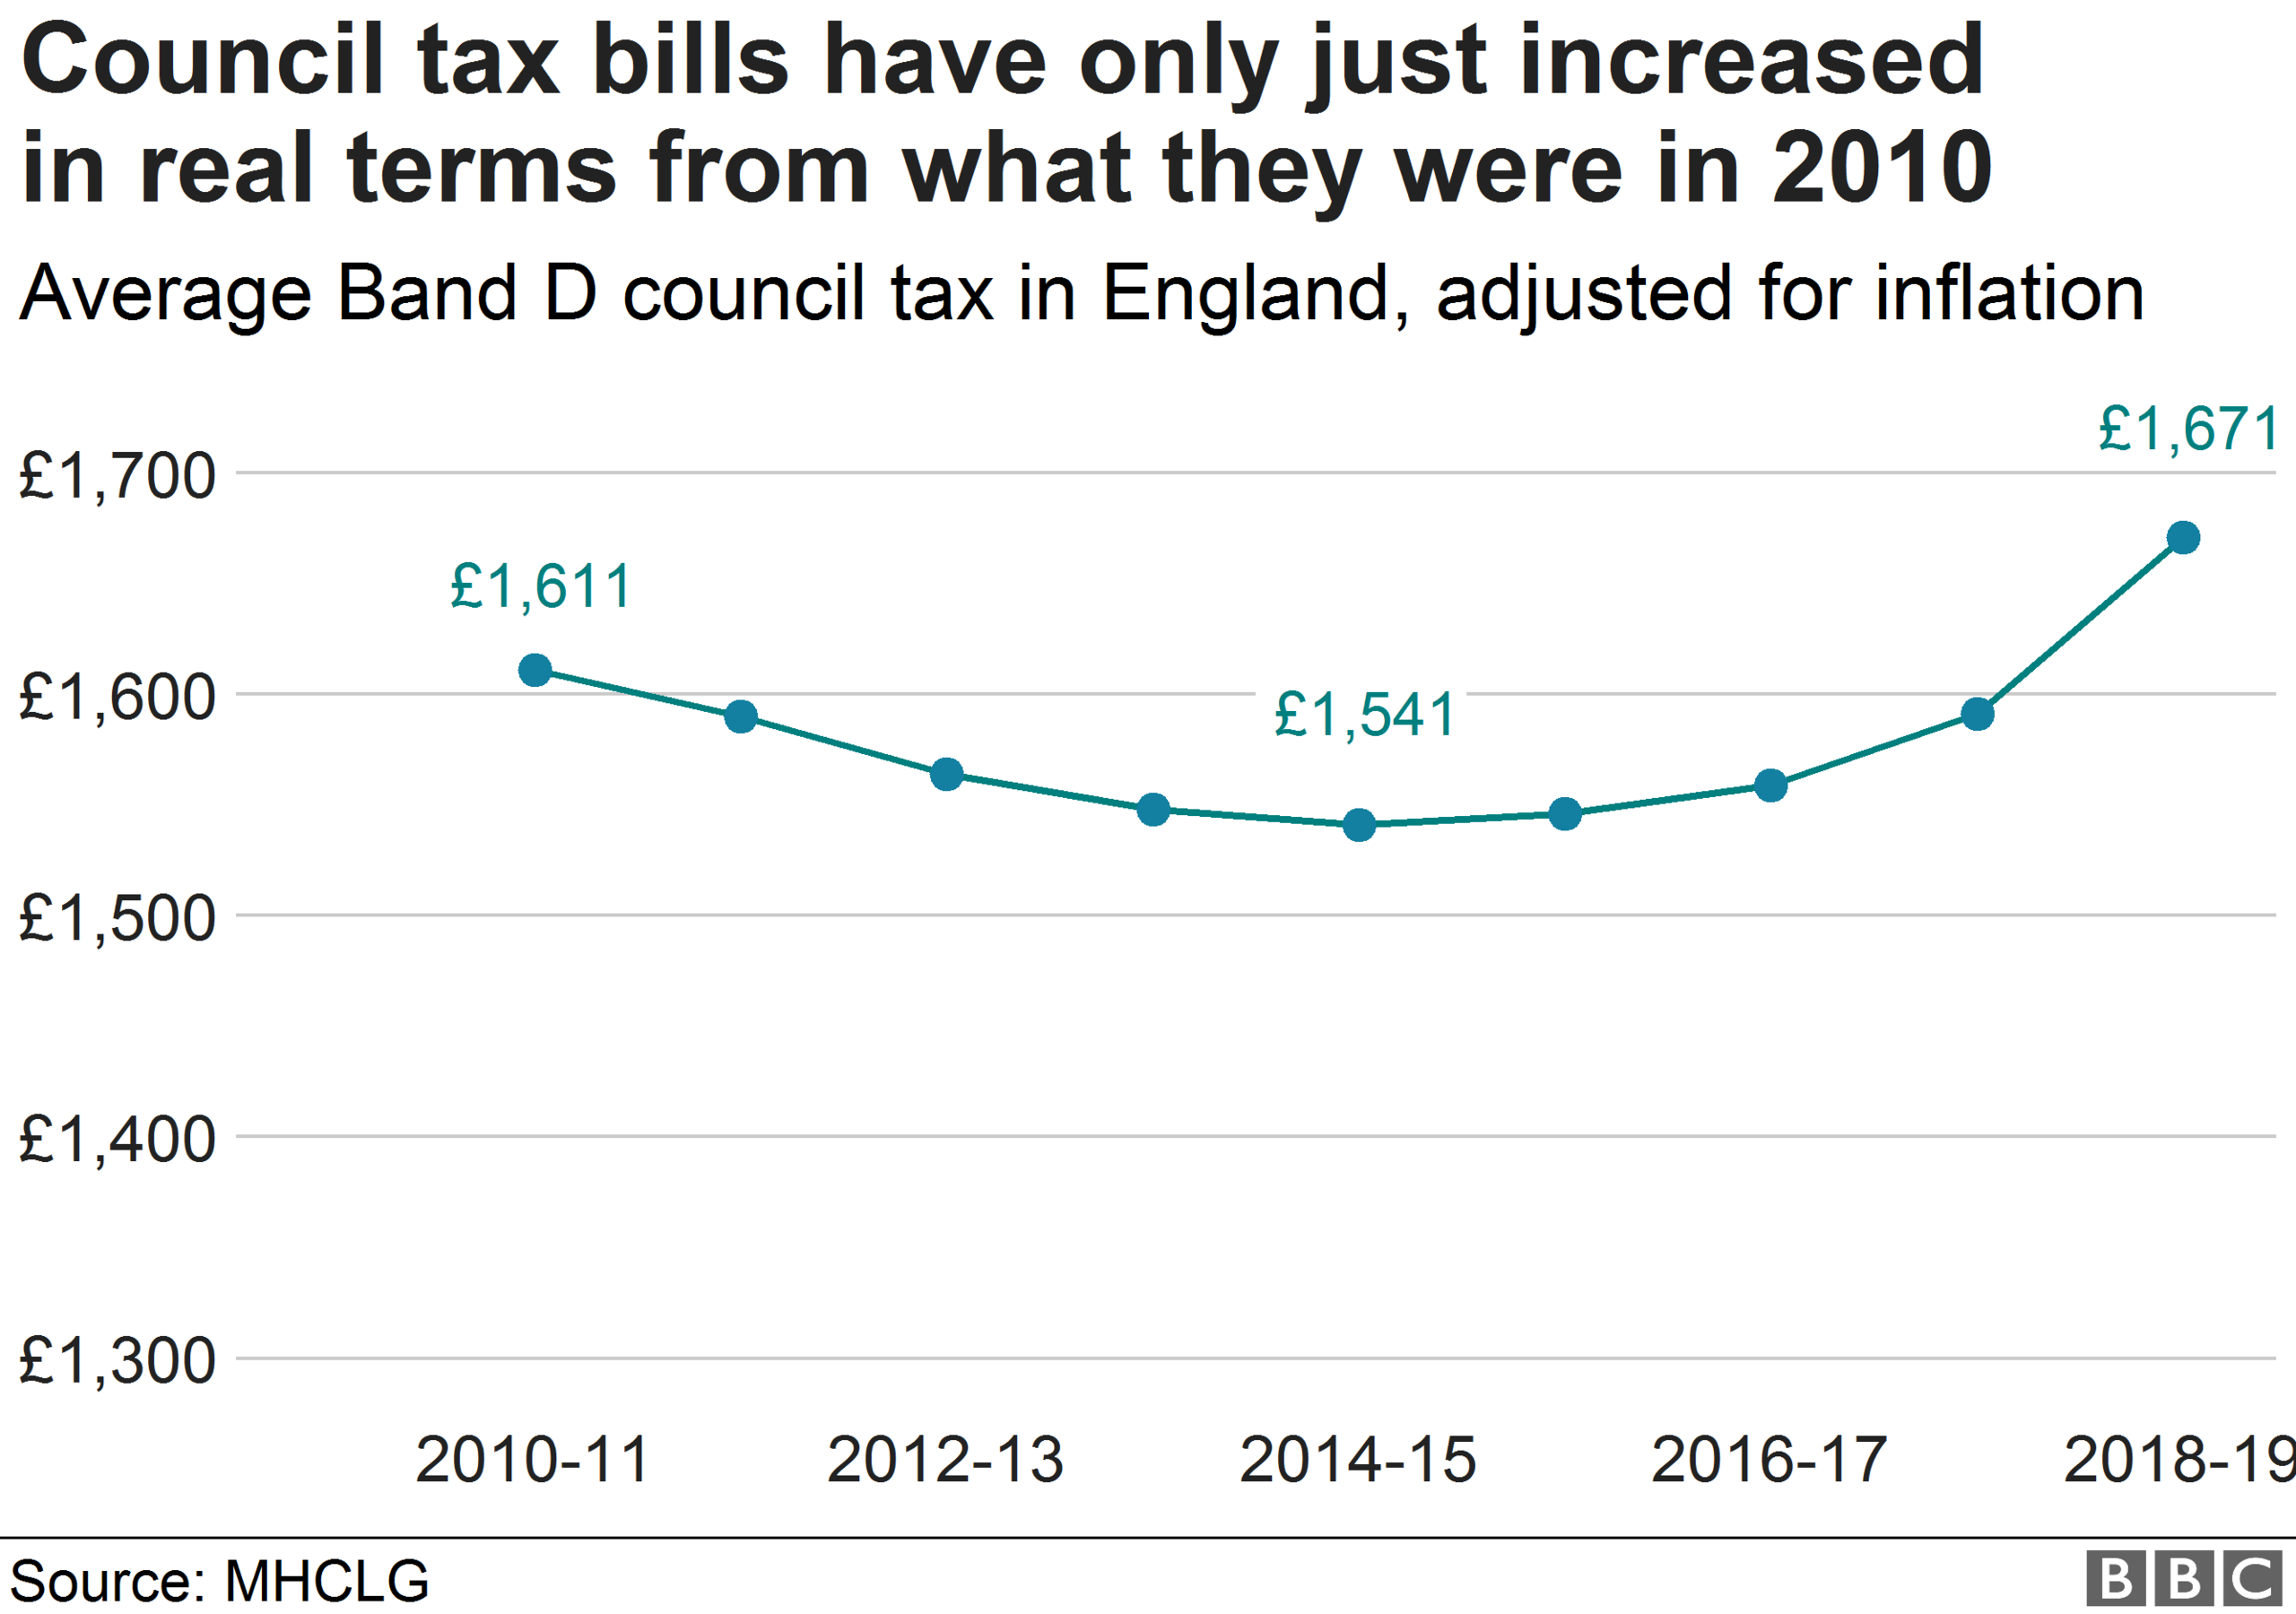
It may surprise some, but in real terms, council tax was actually less last year than it was in 2010-11.
This happened because many councils agreed to freeze council tax at 2010 rates for several years, in return for "freeze grants" worth the equivalent of a 1% rise.
That meant they did not increase in line with inflation. Even with the social care precept introduced in 2015, the average Band D bill in England has only just had an increase in real terms.
Any authority that wanted to increase bills by 2% or more would have had to hold a local referendum.
The cost and the high likelihood of rejection meant few councils were willing to risk it. Bedfordshire's police and crime commissioner held one in 2015 and proposals for an increase were rejected by 69.5% of those who voted.
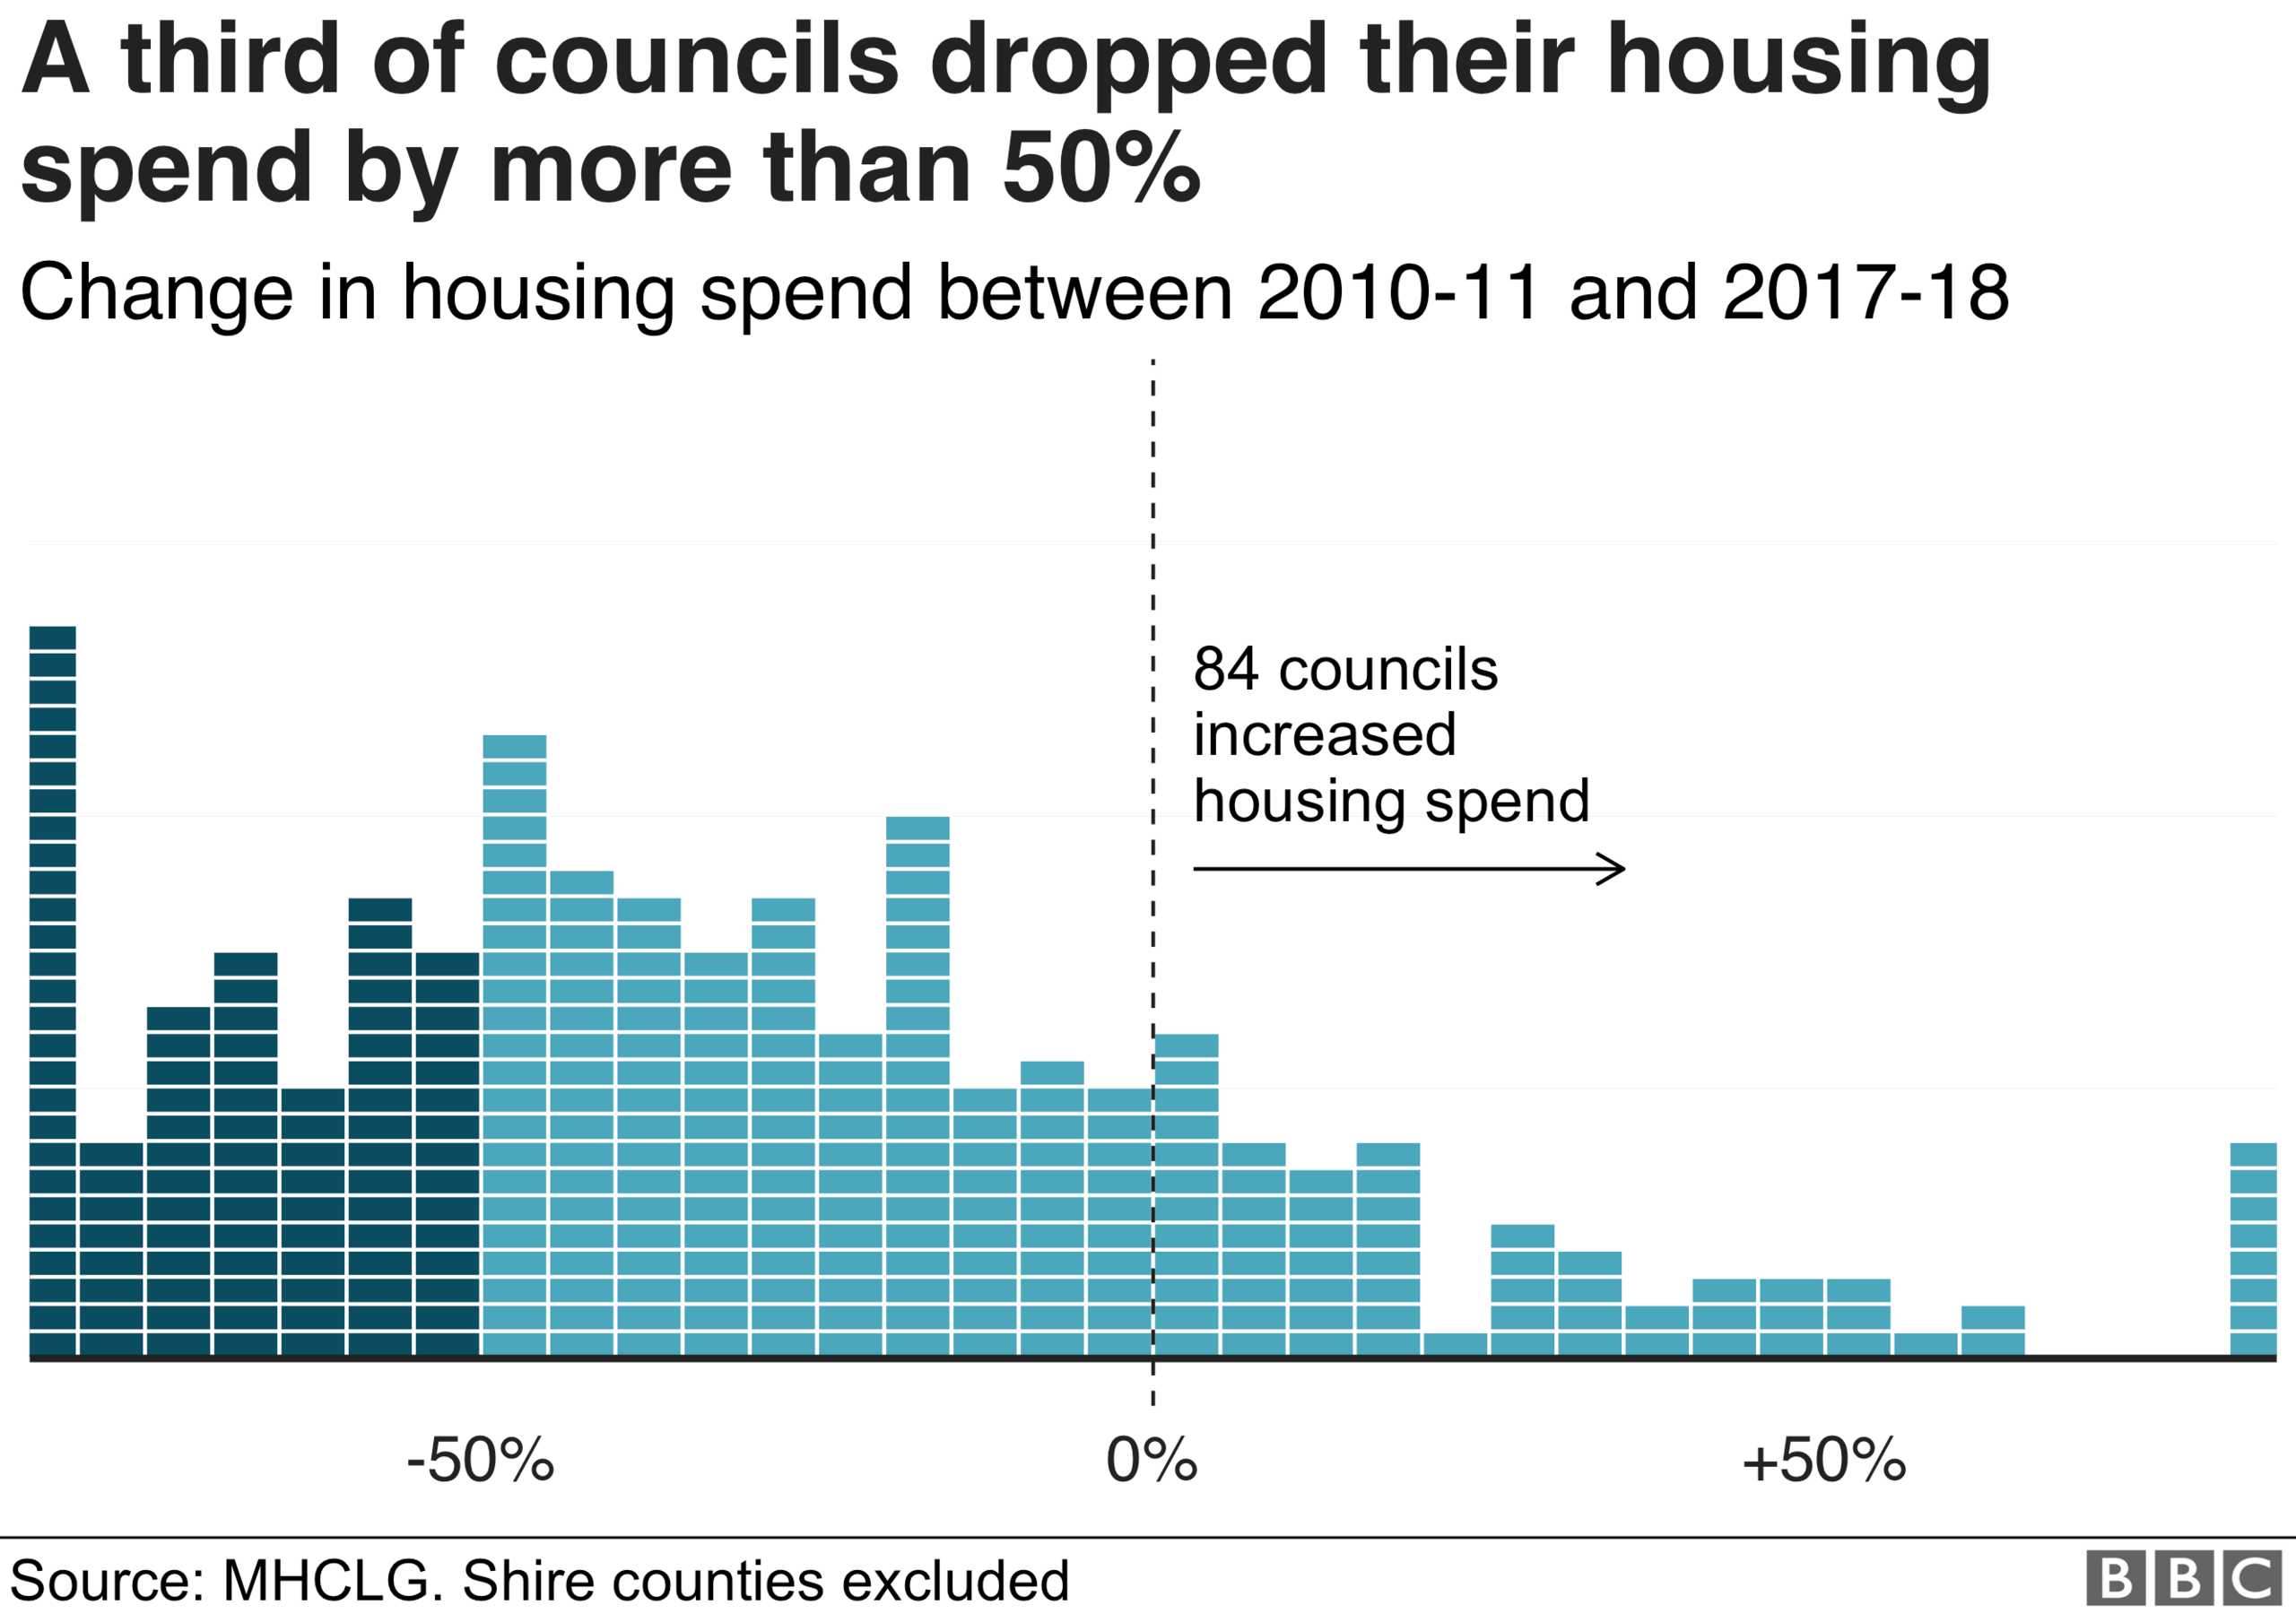
5. A third of councils have had to halve their housing spend
Housing spending has been hit more than most areas.
Since 2010-11, 79% of councils have reduced their housing spend and a third of have cut theirs by more than 50%.
It is a very broad area of work for councils, including everything from administering home improvement grants through to slum clearance, licensing private sector landlords and trying to reduce homelessness.
The overall figure will not tell the full story. Many councils are spending more on temporary accommodation than in previous years as homelessness has increased.
Also, there are anomalies in the official data. Some councils have recorded negative figures, suggesting they made a surplus and cut their spending by more than 100%.
The Ministry of Housing, Communities and Local Government (MHCLG), which requires councils to provide data on spending, says this should not be the case and has contacted councils to update their figures.
6. There's a North-South divide
Not all of the cuts have been spread evenly between regions, either.
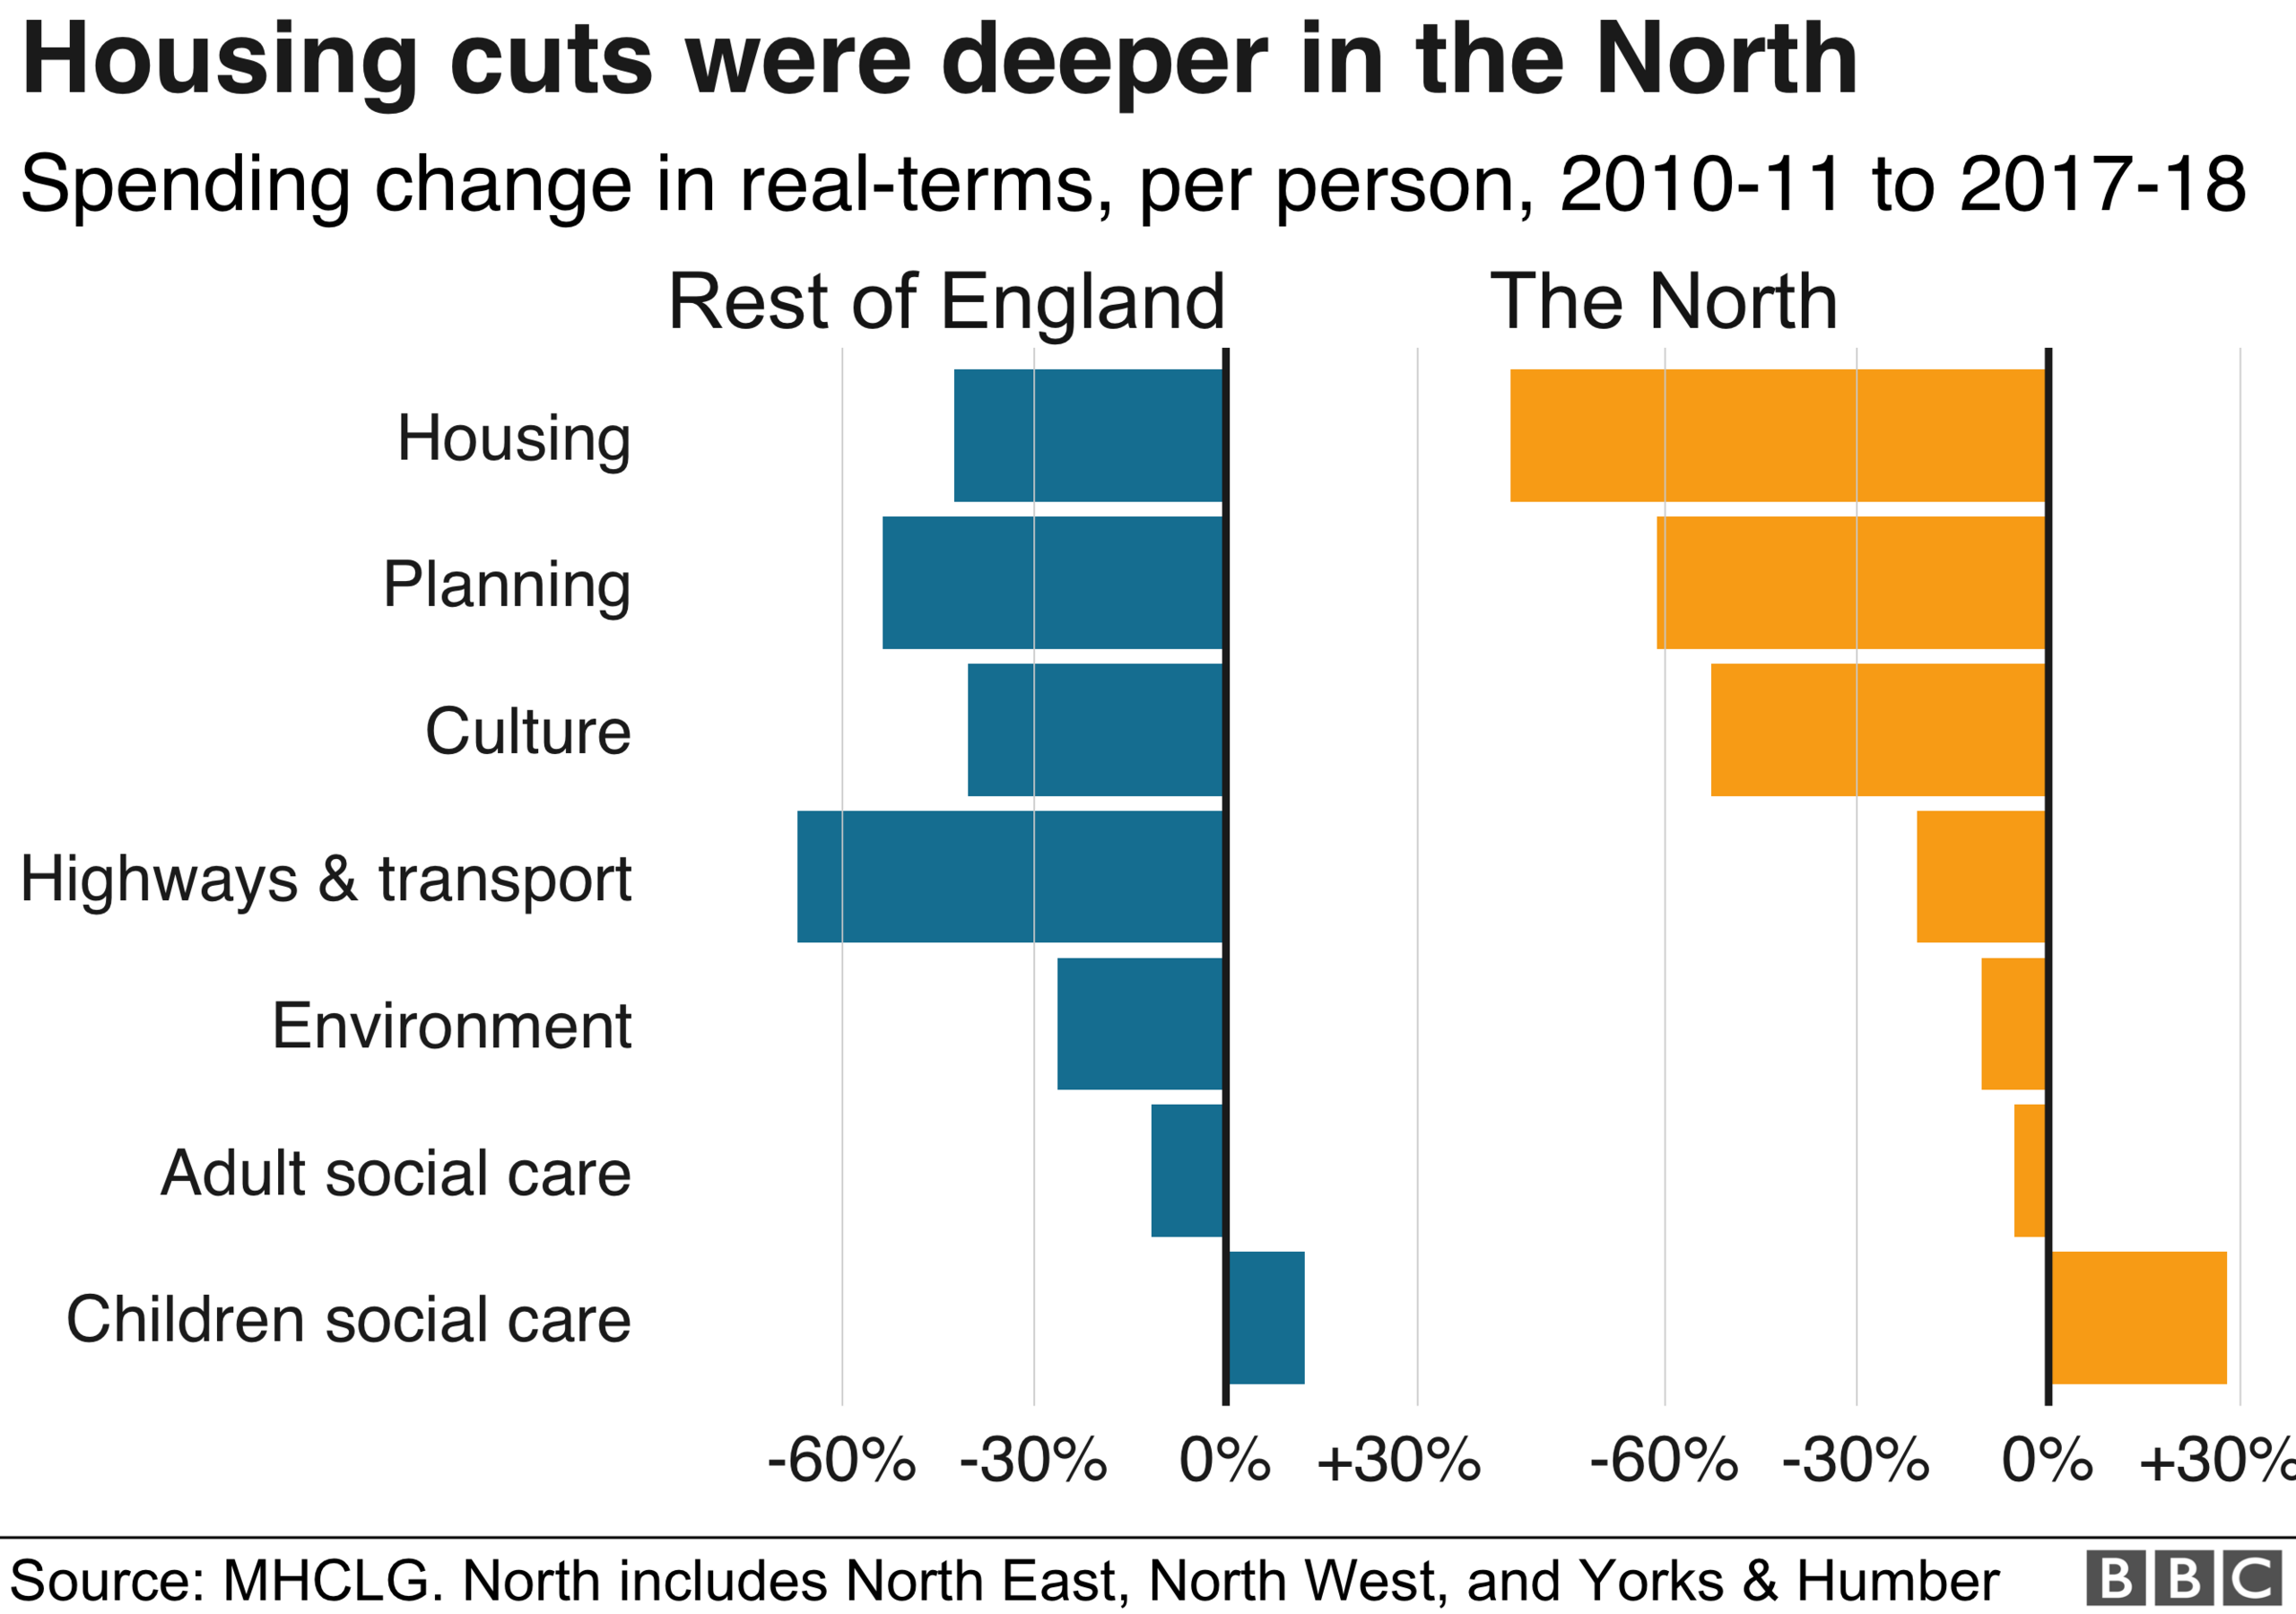
In the north of England, real-term housing spend fell by 84% between 2017-18 and 2010-11, compared with 43% in the rest of the country.
Conversely, though, highways and transport spending was much less hit in the North compared with the rest of England.
7. Some councils are running out of reserves
Thirty-nine councils have reported having the equivalent of less than 10% of what they spent in 2017-18 available in reserve.
These included Northamptonshire County Council, which went millions of pounds over budget and has twice banned spending in 2018.
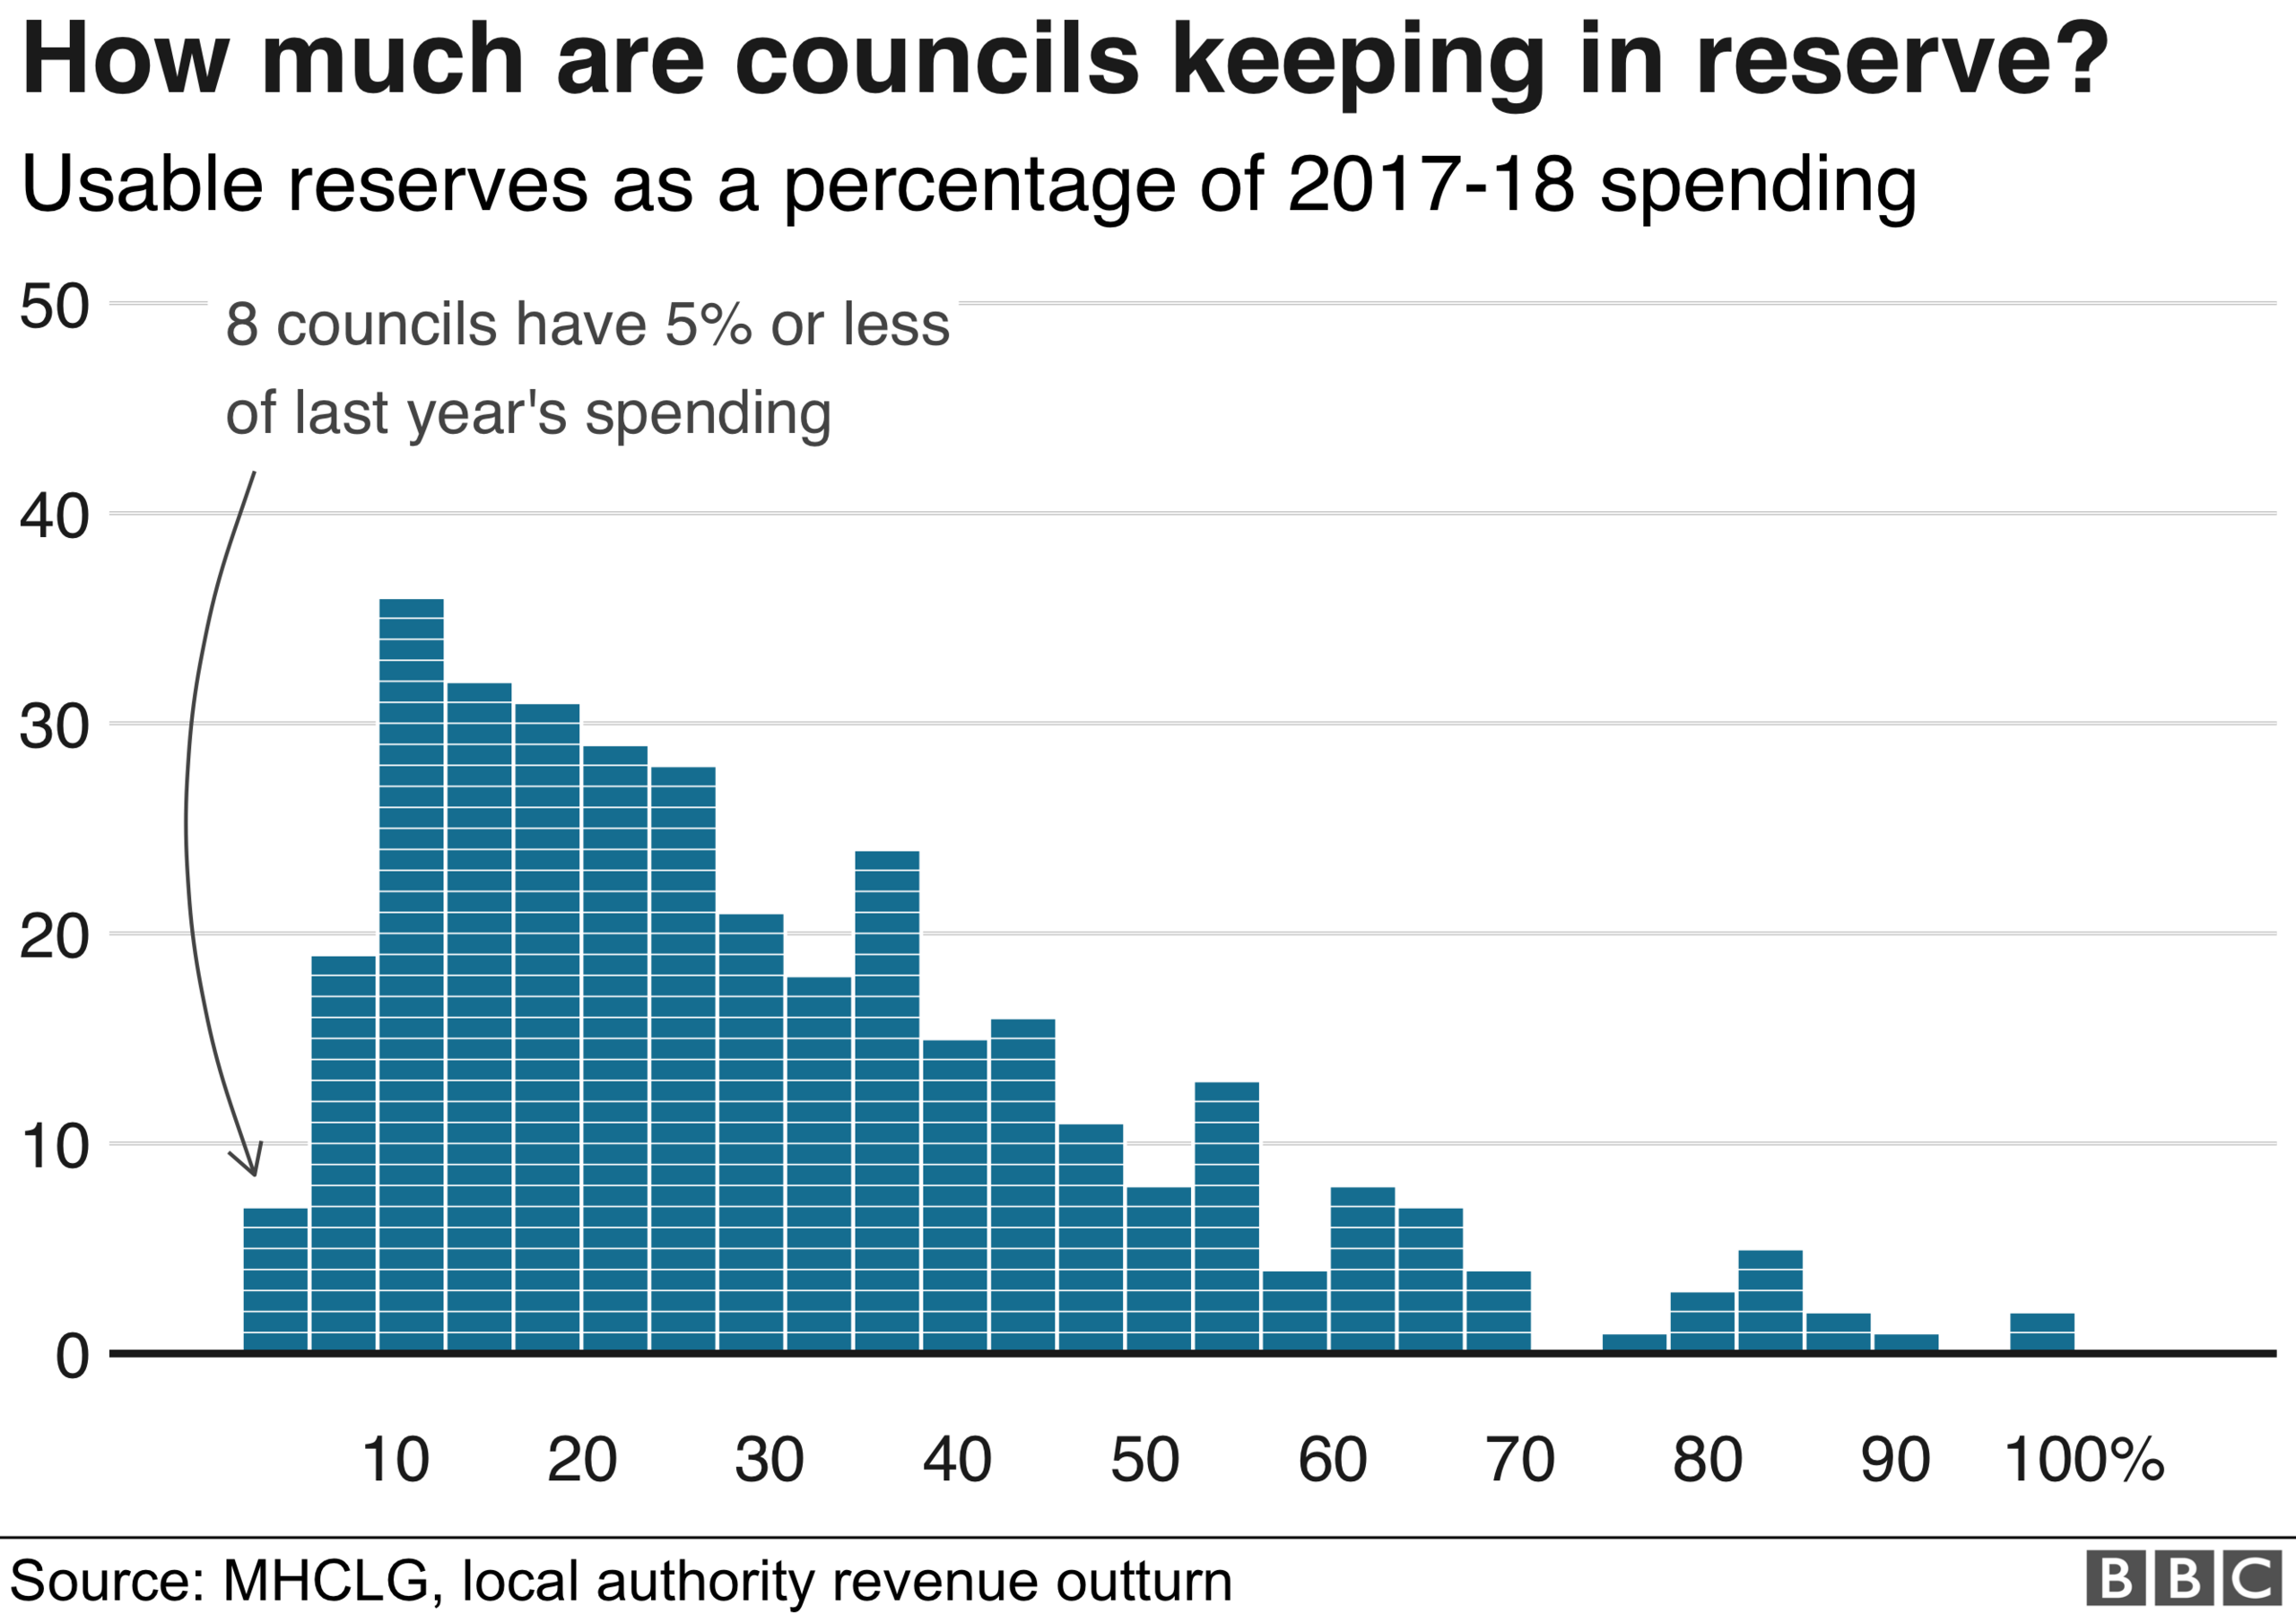
Councils had about £17bn in usable reserves at the end of the financial year. This was up on the previous year, when they had about £16.5bn between them.
However, councils say these reserves have to be available to cover planned projects or unexpected events, such as disasters or legal expenses.
A spokesman for the Local Government Association said: "Using reserves to plug funding gaps is unsustainable and does nothing to address the systemic underfunding facing councils and local services.
"The reality is that the size of cuts councils are having to make and the growing demand for adult social care and children's services are simply too big to be plugged by reserves."
Additional reporting by Paul Bradshaw
Update 5 December: This article has been updated to better reflect the change in the average Band D council tax bill.