Have the poorest councils had the biggest cuts?
- Published

The most deprived council areas of England have seen more cuts than their better-off neighbours, according to Labour leader Jeremy Corbyn.
He was speaking following the launch of his party's local election campaign. So, what do the figures show?
Spending power
Councils receive their money from a mix of central government grants and money raised locally through taxes and charges.
The proportion varies because richer areas can raise more tax from properties and businesses, while poorer councils rely more on central government funding.
A council's "core spending power" is how much money it has to spend from all these income sources.
More deprived councils generally end up with higher spending power per household because they get more money from central government to reflect the higher costs of providing services such as social care.
Labour said it looked at the spending power of the 10 most deprived council areas, according to an official ranking, external published every few years by the government - most recently in 2015.
They are:
Blackpool
Knowsley
Kingston upon Hull
Liverpool
Manchester
Middlesbrough
Birmingham
Nottingham
Burnley
Tower Hamlets
Our analysis found that, across England, the median cut to spending power was £297 per household. That is to say, half of councils had bigger cuts than that and half smaller.
And there was a big range of cuts.
For example, the London Borough of Hackney's spending power per household fell by £1,432, compared with only £1.78 per household in Wokingham in Berkshire.
Only the Isles of Scilly had increased its spending power - by £350 per household.
BBC analysis suggests that all 10 listed areas saw higher than average cuts and for nine of them, that cut was at least twice the average.
Five of the most deprived councils had cuts of more than three times the average.


Most of the areas seeing the biggest overall cuts were in London, followed by other urban centres like Birmingham, Manchester and Liverpool.
They were also mainly areas with relatively high levels of deprivation, while many of the areas with the smallest cuts were in the less deprived parts of England.

This picture is backed up by research last year by the Institute for Fiscal Studies (IFS) think tank, which looked at all councils in England and found that those in more deprived areas face slightly larger cuts,, external on average, than those in richer areas.
A study by Mia Gray and Anna Barford at the University of Cambridge, external also found that "more deprived areas tend to correlate with bigger cuts in service spending", while in the less deprived areas, service spending cuts tend to be smaller.
Labour v Tory
Labour also claimed that the government had protected Conservative-controlled councils more, while Labour-run areas had faced the biggest cuts.
It's broadly true that many Labour-controlled areas have faced bigger cuts than Conservative-controlled ones.
But their calculations - which did not adjust for the type of council - understated the cuts to Tory authorities.
Different councils have different responsibilities - some easier to cut than others. And some people live in areas where a small district council provides some of their services, while a bigger county council pays for others.
Take Horsham, which Labour names in its press release as one of the few councils to have more spending power per household this year than it did in 2010.
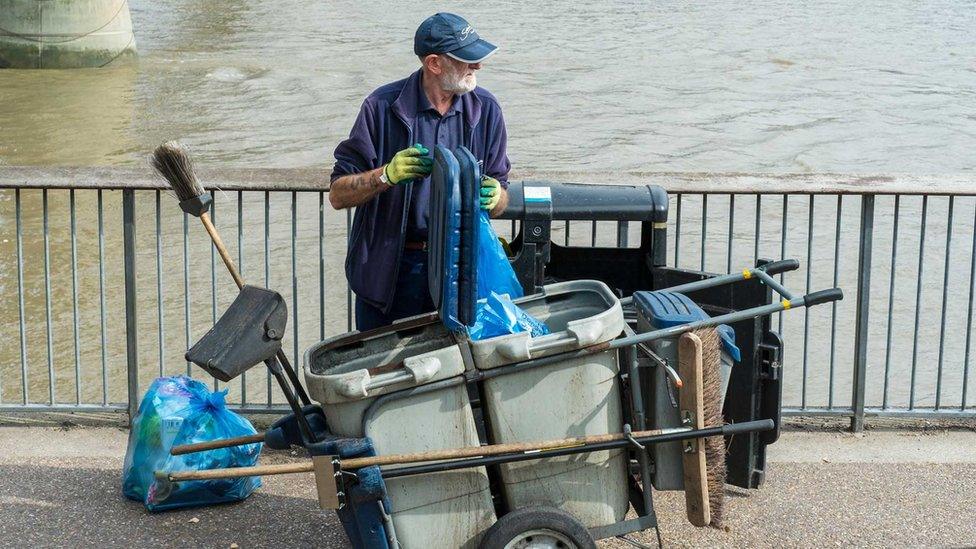
Horsham is a district council which looks after services like bins, planning, parking and housing.
But people living in Horsham will have their social care, education and public health services provided by the county council, West Sussex.
To understand the cuts faced by a household in this area, you have to consider both councils together.
Horsham residents - who Labour said had seen an increase in spending power - have actually faced overall cuts of £75 per household once you factor in cuts to services provided by West Sussex County Council.
That is still a small cut compared with many parts of the country, but adding in the county council does change the picture somewhat.
A Labour Party spokesperson said: "Our methodology and how we present our research corresponds to how official figures are presented."
Council elections: Why don't two thirds of people vote?
It's also true that many Labour-controlled councils started with considerably higher spending power, and still had higher spending power than their Conservative-controlled neighbours this year, despite having faced bigger cuts.
This higher overall spending power reflects the fact that many of the most deprived council areas are Labour controlled, and those areas are allocated more money because of their higher needs.
More money
Prime Minister Theresa May told the House of Commons that councils in England had more money to spend this year.
A Ministry of Housing Communities and Local Government spokesperson said: "We are providing local authorities with access to £46.4bn this financial year to meet the needs of their residents and the most deprived areas have access to substantially more funding than the least."
English councils' spending power is set to rise by £1.3bn in the current financial year - but only provided they increase council tax by the maximum allowed.
That is a slightly bigger rise than in recent years, but it still means they have 4% less money to spend per household on average than they did in 2015.
Since 2010, council spending power, including funding from central government and local taxes, has fallen by almost 30%.
Additional reporting by the BBC England Data Unit.


- Published5 December 2018
- Published5 December 2018