Election 2017: How do the parties expect to do?
- Published

Can we learn something about the results we will wake up to on Friday morning by looking at where the party leaders have been campaigning? We have - as an experiment - been trying to see what we can discern about the parties from their movements.
Based on their recent visits, I think the party leaders' choices of venue suggest the Conservatives are expecting to pick up a hefty majority. Labour's expectations are much harder to read.
To understand the pattern a bit better, let us start with this chart - which is a bit like a swingometer. Each block represents a Tory-facing Labour seat (in red) or a Labour-facing Tory seat (in blue). And each stack of blocks tells you how many seats each party gains if they improve their polling, in two percentage points increments. Seats near the centre line are more marginal. Seats further away are safer.
We can then overlay this with black markers, which show all the places that Jeremy Corbyn and Theresa May have visited. Here, then, is the distribution of trips by the two main parties' leaders since the Conservative manifesto launch in mid-May - for Labour and the Tories.

The Tories have dispatched Theresa May fairly consistently to the same sorts of seats since the campaign began: largely Labour-held seats which would require fairly big swings to take. Let us assume that the Conservatives have not sent her to places that are absolutely safe nor dead losses. This pattern can give us an idea about which seats the Tories think are in play.
So I've also drawn in a line, which marks a plausible frontier between the two parties. That implied frontier is a guess about how big a swing the Tories think is plausible, based on how far out they've dared to push those campaign visits.
Do not read too much into the specifics here: I think reasonable people could draw them into different places. But this approach may help us with a ballpark estimate of broad Tory expectations. (Drawing in a line is of no use for Labour: I have written before about how Labour does not appear to be pursuing a strategy of deploying Mr Corbyn directly into the front line - we will come to them later.)
Tory expectations
What, then, to make of that Tory frontier line? If you simply assume the Tories were to win up to the line implied by their frontier, they would take around 81 seats. That would imply a tremendous landslide. But that is to miss an important factor about where these visits have arrived. The Tories have been focused, as I wrote at the start of the campaign, on pro-Leave seats with lots of UKIP voters.
So here is the same chart, redrawn with only those seats recording a 60%-plus Leave vote, according to estimates of constituency referendum votes by Dr Chris Hanretty at the University of East Anglia.

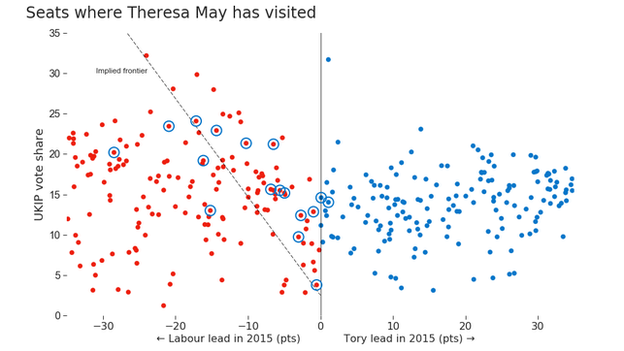
The Tories have been focusing heavily on this pro-Brexit part of England and Wales - and that frontier I drew on the first graph really reflects the Tories' big ambitions in these sorts of seats. A line in the neighbourhood I've drawn in here would give them around 25 of these sorts of seats. Conversely, though, the Tories have scarcely bothered with the strongly pro-Remain seats. I have not drawn a frontier on the basis of one dot - but it does not imply great ambitions for these low-UKIP seats.

That, of course, leaves the rest of the country - where neither Leave nor Remain got 60%. And you can see that while Mrs May has been campaigning here, she has been a little more modest in her ambitions than in the more strongly pro-Leave areas. My suggested frontier here that would give her around another 20 seats.

Another way to consider the question of where you draw these lines is to look at these constituencies on this graph, which shows individual seats as dots. The further left or right they are, the safer they are. The higher they are, the more UKIP voters they have. The blue rings are prime ministerial visits. I have had a go at drawing in a frontier here, too. You get similar sorts of numbers from looking at it this way, too.

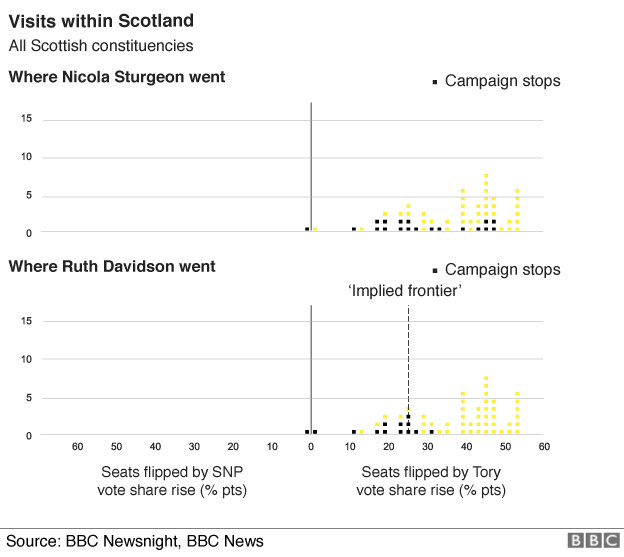
What about Scotland, though? Theresa May has made few visits north of the Tweed, but Ruth Davidson's Conservative and Unionist Party, as they have been branded in lots of places, have another leader. So here is the chart showing her visits, and Nicola Sturgeon's. (You can read more about the geography of the Scottish campaign over here.)

The first minister's visits are a bit complicated to read: she is running a defence against three parties. So some of those seats are getting visits because they are under threat from the Liberal Democrats, say. But if I draw in a line for Ms Davidson's visits as I did for Ms May's, it implies hoped-for gains of somewhere around 10 to 15 seats.
All in all, these simple exercises give you implied Tory gains of, somewhere between 50 and 60 seats. I might have drawn the lines too far out in some cases, and too close in in others. But the big picture is that the Conservatives believe they are heading to a big win. It is hard to pick frontier lines that do not lead there. Remember, though: this is not a forecast, but an attempt to guess at what the Tories' campaign implies they are aiming for.
Rallies and television
As I mentioned, the Labour leader's visits are harder to read. If I were to simply draw in a frontier for Labour, based on their most ambitious visits, it would imply they expected to take 40 seats from the Tories - which is definitely not the expectation of people involved in running the campaign inside the Labour party.
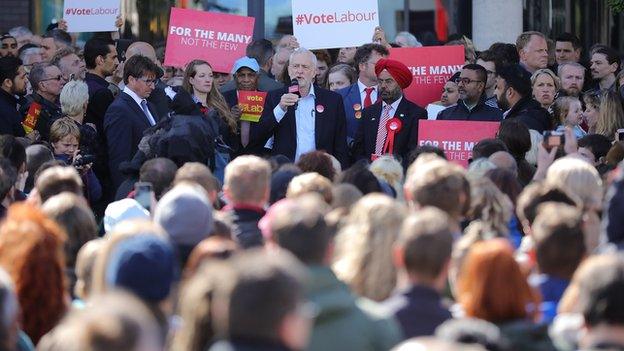
It is, in particular, hard to make sense of Mr Corbyn's alternating visits to Tory-held marginals and then very safe Labour seats. I have written about this pattern before - but it is possible that Mr Corbyn keeps going to safe seats where he can hold big events, which look much better on television than Ms May's. And remember: local TV news matters.

Jeremy Corbyn's campaign stop in Telford
Indeed, if, instead of looking at constituencies, we look at the different ITV news regions visited by the two leaders, you can see Mr Corbyn has been going to the same sort of geographical regions as the Tories (with a bit more effort in the Anglia region, where the Tories are defending a lot of marginals). Boiled into TV terms, they are going to similar places.
So it is possible that Labour has the same diagnosis about the likely dynamics of this race. They are just choosing to use their leader in a different way to fight it.
I will return to this later to see if this experiment has yielded useful information. Maybe the lesson will be that the parties know nothing. Maybe the shape of any swing will fit this rough pattern, but the size will be different. Or vice-versa. Maybe we will learn that parties deploy their leaders over-optimistically or over-pessimistically? Maybe there's evidence in there, but I am missing it.
I have no prior example to work from, and have used lots of fairly arbitrary judgment calls here - particularly around where the "frontier" line goes on our graphs. Labour's pattern of visits is difficult to make sense of. It is hard to escape the assumption, though, that the Tories are behaving as though they expect to make quite big gains.
If we tinker about with those sorts of questions, and polling remains difficult to follow, leader visits may prove to be a useful tool. Maybe not. We will know more on Friday morning.
Additional reporting by Jack Evans, Daniel Dunford and Nassos Stylianou