Covid: Johnson says Covid statistics 'irrefutable' amid new row
- Published
- comments

Boris Johnson has defended how Covid statistics are being used after data shown in a presentation to justify the lockdown in England had to be revised.
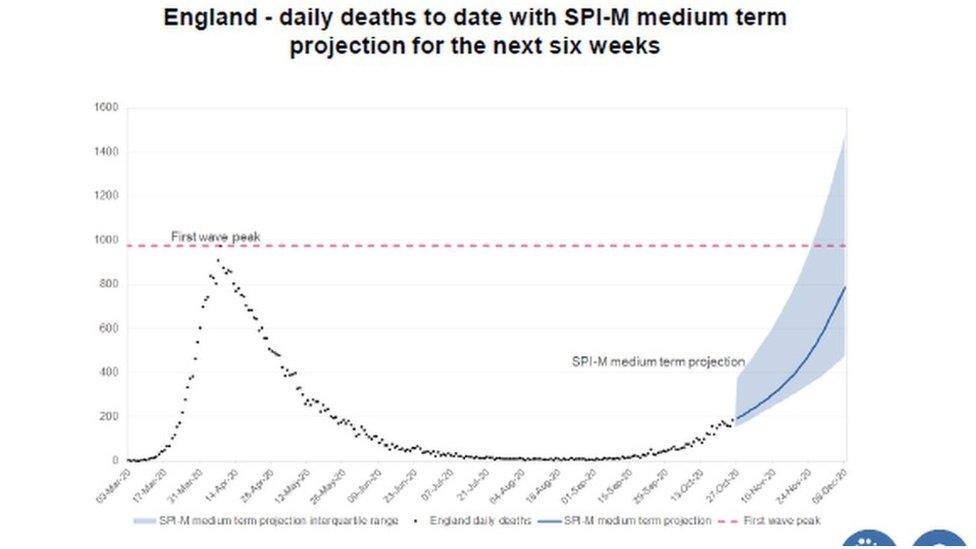
A chart presented at Saturday's No 10 briefing suggested a worse-case figure of up to 1,500 deaths a day by December 8, well above April's 1,000 peak.
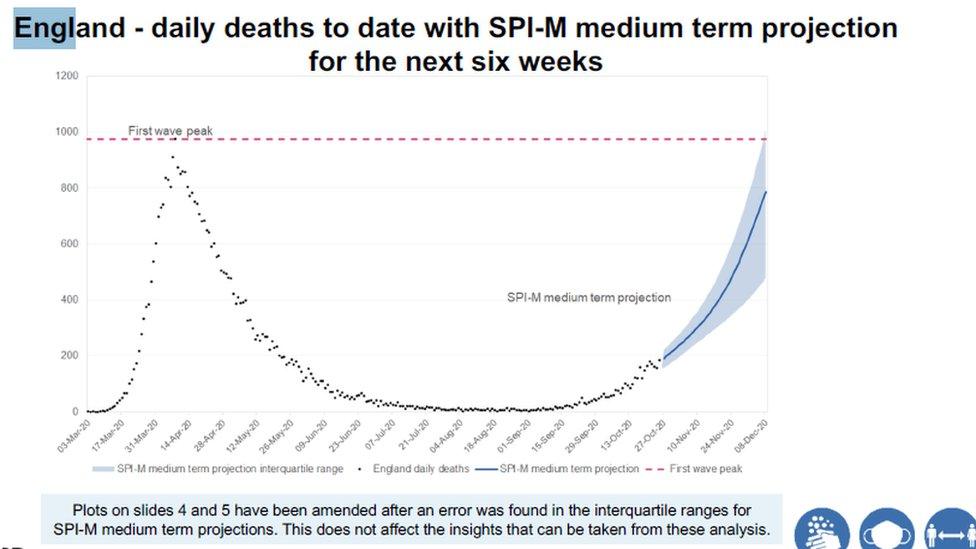
This has now been adjusted down to 1,010 a day, after an error was found.
No 10 has accepted a mistake was made but the PM said data on the spread and impact of the virus was "irrefutable".
Speaking during a visit to the East Midlands, Mr Johnson said the number of people being admitted to hospital was "climbing fast", having gone up by 25% in the last week.
"The data is really irrefutable about what is happening in the country," he said.
"The number of deaths alas is on an upward curve that is just unmistakable, more than any time since May, and the government has to act. That's why we're taking the steps we are."
Conservative MPs opposed to the second lockdown in England, which came into force on Thursday, have questioned the reliability of the modelling used by the government to bolster its case.
The UK's statistics regulator says there needs to be more transparency about the data used to make predictions after it emerged figures cited at last weekend's Downing Street briefing were out of date and over-estimated deaths.
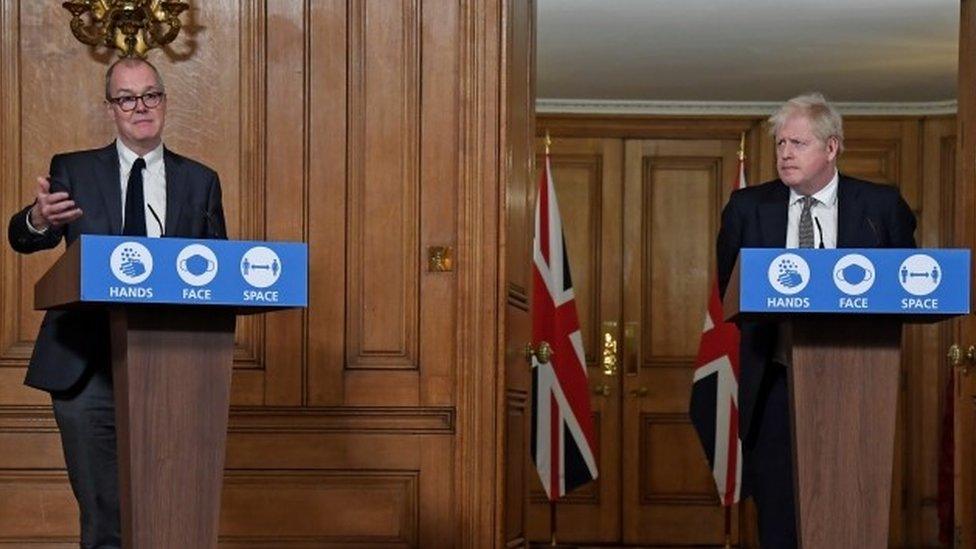
At the briefing, the UK government's chief scientific adviser Sir Patrick Vallance presented a graph outlining a range of projections for the Covid death toll over the next month, including one from Public Health England and Cambridge University suggesting it could rise as high as 4,000 a day.
He also cited two other graphs illustrating "medium-term" projections from the government's advisory committee SPI-M for hospitalisations and deaths up to 8 December.

How the graph looked when it was presented by Sir Patrick Vallance at Downing Street briefing


The amended version published by the government

On Friday, the Daily Telegraph reported, external that some of the details in the graphs had since been changed.
The Government Science Service found an error in the charts, affecting the upper limit for the possible outcomes shown by the shaded areas. For hospitalisations, the incorrect upper limit shown was 9,000 instead of 6,200.
But the central line was not changed and the government argues that the error "did not affect the insights".
The PM's official spokesman acknowledged an error had been made but insisted there was no error in the "underlying analysis", adding that Mr Johnson continued to have confidence in his chief scientific adviser.

The errors in the Chief Scientific Adviser's slides all gave the impression that the worst case scenario is more serious than current data support.
But the government's case for action does not rest solely on future projections of a worst case scenario. They argue that the numbers of people going into hospital or dying right now make the case.
Coronavirus hospital admissions are currently doubling roughly every three weeks.
Deaths are doubling every fortnight, with just over 2,000 reported in the last week. That growth is slower than it was in September and October, but it is still growth.
So in the near future, the expectation, not the worst case, is that the daily number deaths will rise and pressure on hospitals will increase.

Business Minister Nadhim Zahawi told Sky News the government would "strive to improve our graphs and presentations" but the threat facing the NHS from the rise in cases was "very clear".
The health service in England has been placed on its highest alert level ahead of what its bosses said was a "very difficult winter" ahead.
Speaking on Thursday, the chief executive of the NHS in England Simon Stevens said there were more than 11,000 Covid patients being treated in hospital, up from 2,000 at the start of October.
But Sir David Spiegelhalter, one of the most respected statisticians in the country, said he had been "very unimpressed" by some of the data presented in recent times, particularly Saturday's scenario of possible deaths.
"It was a frightening graph and presented these headline figures of 4,000 deaths a day which is terrifying," he told Politics Live on Tuesday.
"But there are a number of problems. We did not have the sources of these projections and if you look at the small print, you see they were done at the beginning of October...And at least one of the groups have revised their projections since."