Unequal Scotland? - How our income shapes who we are
- Published
Professor David Bell says that in income terms Scotland has an unequal society
Throughout this week I will be looking at how equal or otherwise Scotland is. Here, I examine income inequality and discover changes in the UK-wide picture over the decades. Read on - you might be surprised by some of my findings.

Rodger Nisbet is executive chairman at Walter Scott Asset Management in Edinburgh's Charlotte Square and last year company accounts showed the top-paid director earned £8.2m.
That's not much compared with Sir Martin Sorrell, chief executive of WPP - the world's biggest advertising agency - who "earned" £70m for his work last year.
They exist in a rarefied world of hyper-earners - one making money from investing for his clients, and by doing so successfully, that brings very generous bonuses.
The other is closer to the business of creating wealth, by building a giant firm and having his bonus structure based on its performance. Directors of the company presumably reckon Sir Martin is worth it - or else, that replacing him might be more expensive. WPP shareholders don't all agree, and there was a minor revolt.

BBC Scotland's Douglas Fraser poses the question - How unequal are people in Scotland?
Throughout this week, the BBC's Reporting Scotland (Monday-Friday 18:30) and Scotland 2016 (Monday-Thursday 22;30-23:00) will be looking at inequality in Scotland.
Such salaries are a long way from the increasing number who find their wages bunched around the minimum wage.
For someone aged 16 or 17, working for 40 hours a week and getting holidays paid, the annual pay is £8,300. For someone aged above 24, that would be a minimum hourly rate of £7.20, falling just short of £15,000 for the year.

Sir Martin Sorrell, chief executive of WPP, has a multi-million pound annual salary
But we know that many people don't get paid holidays or regular hours. Many choose to work part-time. Some are self-employed, so the legal minimum does not apply to them. Either way, income can be much lower than that. It can then be topped up by benefits, tax credits and pension.
On that basis, we get to a comparable weekly earnings, which is the measure by which economists can assess inequality.
How unequal is Scotland?
On the basis of comparable weekly earnings, the top 2% of Scots have an average income of £2,000. Less than 2% of that is from benefits. The numbers are not that reliable, but it's a comfortable wad. The lowest income Scot is on less than £100, and at the lower end of the spectrum, benefits can supply around two-thirds of average income.
These are extremes. And one characteristic of recent trends is that the top earning 1% has been pulling away, at nearly four times the rate of growth of the next highest percentile.
In turn, that second percentile has seen wage growth twice as fast as the third percentile. Below the top earning 10%, Stirling University analysis shows there has been very little change in the share of income between 1997 and 2009.
The share of total income taken by the top 1% of earners rose in Scotland from 6.3% in 1997 to 9.4% 12 years later.
Did you know? - If Scotland were 100 people, the top paid person has seen income grow nearly four times faster then the person in second place.
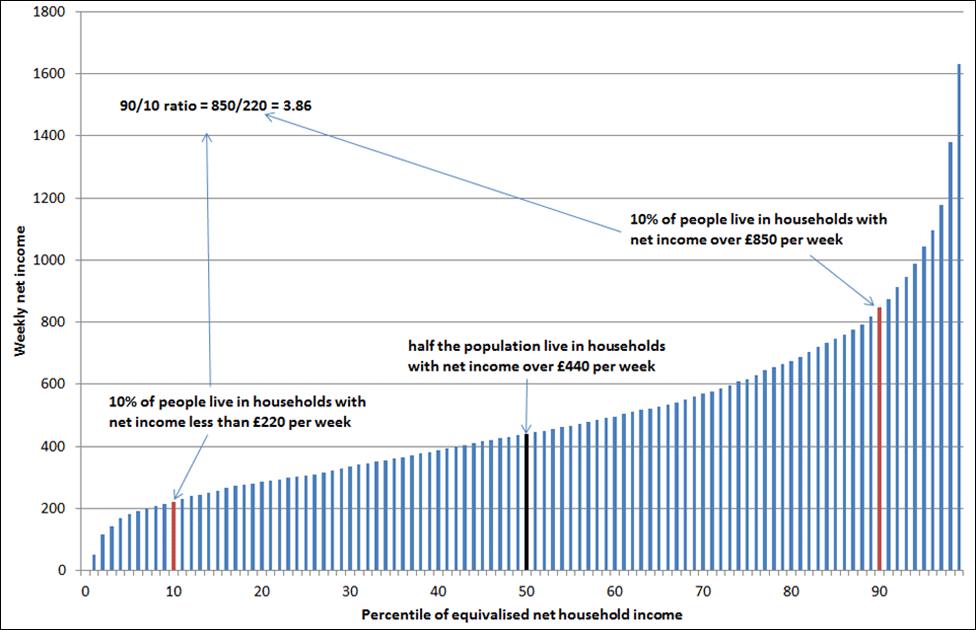
It can be more meaningful to compare those who are not at the extremes. That can be done by comparing the top 10%, taken together, with the lowest-earning 10th. But, arguably, the best comparison is between the person in the 10th highest-earning percentile, compared with the person in the 10th lowest-earning percentile.
To explain, imagine 100 Scots, representing the spectrum of income. The person in the middle is the median. (Because the top end is so skewed, the average is earned by someone higher-earning than Scot Number 50.)
The comparison, then, is between person number 10 out of the 100, and person number 90: the person whose income is more than only 10% of fellow Scots, compared with the person whose income is more than 90% of Scottish earners.
According to the analysis of data by Stirling University's Prof David Bell with David Eiser, the median (Scot Number 50) is on £464 per week, including earnings, benefits and perhaps a pension. That's about £1,800 per month.
According to the most recent figures, the 10th highest earner was on £881 per week, and the tenth lowest was on £236. Compare those two, and you get to the 90/10 ratio - Scot Number 10 earns 3.73 times as much as Scot Number 90.

Ratio measures of inequality for Scotland (2012/13)
How have the figures changed over time?
That ratio has risen. In 1983, in Scotland, the Stirling economists calculate that the 90/10 ratio was below three. It rose steeply until the early 1990s. That was at a time when well-paid manual, industrial jobs were being shed.
Trade unions, which had negotiated that relatively good pay, were being weakened, through legislation and through lower membership and bargaining power as the economy shifted towards the service sector.
But since the early 1990s, that growth has slowed. Remember that the really startling growth in income has not been for the person who earns more than 90% of others, but for those who earn more than 99% of others.
Did you know? - If Scotland were 100 people, the lowest 33 spend 10% of income on fuel, the top 20 spend 5% on fuel.
To get a fuller picture, you then have to add the impact of benefits. After the 1997 election, with the Labour government, tax credits were introduced, which made a significant impact on low income for families and for pensioners.
Measured by households, rather than individuals, the steep rise in inequality of the 1980s is in contrast with a much steadier level of income inequality since then.
And while Britain is relatively unequal in its distribution of pay, its welfare system does relatively more than others to compensate for that.

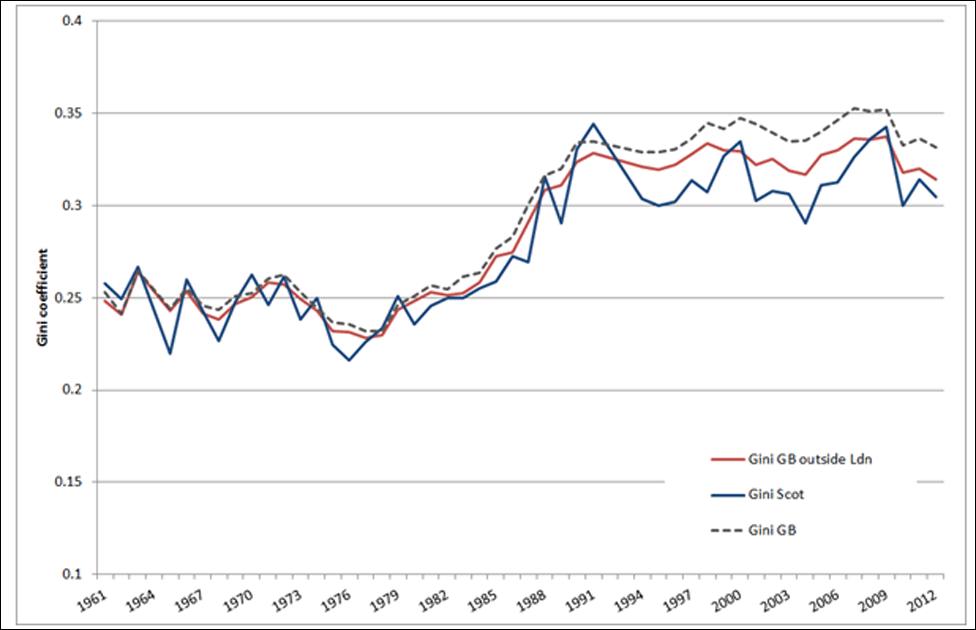
Inequality of household net income, 1961-2012 (Source: Households Below Average Income)
This chart - like the others it's published with Stirling University research - shows how inequality has fared for Scotland, for Britain including London, and for Britain without London.
It shows that the 1960s were a time of relatively low inequality. It dipped further in the late 1970s, and then rose steeply through the 1980s. Since then, it has looked volatile, but the trend line has been broadly flat, while the London effect has pulled it apart from the rest of Britain.
If London were a country how would it rate?
Income inequality in Great Britain has been largely driven by what's happened in London.
Between the financial sector, with its giant bonuses, and the growth of a global elite which chooses London as one of its favourite cities, inequality in the capital has grown much faster than the rest of Britain.
If London is stripped out, then the rest of Britain has seen very little growth in inequality since the early 1990s.
Economists' favourite tool for measuring inequality is called the Gini co-efficient. It is a number between zero and one. At zero, there is absolute equality of income. At one, all the income is concentrated in the hands of one person.
Scotland's Gini co-efficient has been around 0.33 to 0.35 since the early 1990s. In London, it is around 0.4.
Did you know? If Scotland were 100 people, the lowest 10 get 69% of their income from benefits
How does that compare with other developed nations? The Organisation for Economic Co-operation and Development (OECD) does the maths on this. Out of 34 countries in 2009, Chile was the most unequal, with a Gini co-efficient at 0.5. The USA was 31st most unequal, and the UK was 29th, between Israel and Spain.
But that London effect makes a big difference. If London were a country, it would have the fourth highest inequality in the table. And without London, the rest of the country would be mid-table.
Scotland would be just above it, at number 22, between Italy and Estonia. By this count, Slovenia, Norway and Iceland are the most equal countries in the OECD.

Net income inequality in OECD countries (2010). Sourced from OECD and HBAI
Why is there such inequality?
There are many economic studies trying to answer that question, with differing outcomes. Some of the reasons given are the changing pattern of the labour market.
These have increasingly rewarded those with global and advanced technical skills, while those who are not globally mobile compete with cheaper foreign workers to do less-skilled jobs.
And while some jobs have been offshored to cheaper locations, many more jobs have been replaced by automation, while new jobs have been created which cannot be done by machines, including a growth in the social care sector.
Because people and companies have become more international and mobile, the threat that they might uproot and move elsewhere means they are able to pressure governments to lower tax rates on earnings and profits.
Did you know? If Scotland were 100 people, those in the middle get 56% of their income from wages, 10% from self-employment and 33% from welfare payments.
As 24% of all Britain's income tax comes from the top 1% of earners, there's an incentive to do what it takes to keep them and to attract more people like them. Yet there's also a political pressure to ensure they contribute more through tax.
While there are reasons for the gaps, there are also reasons why the gaps aren't bigger. One effect of the welfare system is to redistribute, using tax on high earners to provide benefits to low earners, particularly to retired people and those with families.
By international comparison, Britain is relatively unequal before redistribution. But the effect of that re-distribution is greater, which brings its post-tax and post-welfare inequality back into the main range of similar countries.
Does the issue of inequality matter?
It matters economically, if the broad range of middle-earners do not have disposable income to go out and spend. Without them as customers, businesses struggle to grow.
It matters politically because it is harder to maintain a consensus and a social contract while people feel there is an unfair share-out of income and of wealth, and while they feel their chances of moving up the income ladder is being blocked.
It also matters in the impact it has on education, on health, and life chances, which lead to a series of other inequalities.
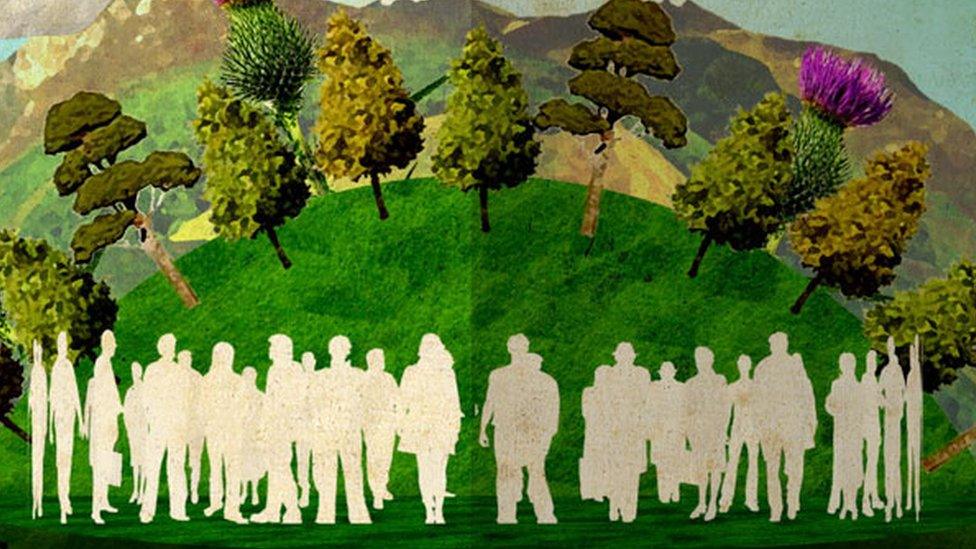
If you were to imagine Scotland as 100 people, who would they be?
What can be done about inequality?
One question worth asking, before that, is how much you want to address inequality, and by how much. The current patterns of inequality are not inevitable, but equality of income carries a big price.
If everyone earns the same, there's no financial incentive to gain extra skills or to take risks, both of which are essential to gaining productivity and growing the economy. So if you wish to reduce inequality, it is worth considering the point at which your redistribution of income has reached an optimal point.
If the current patterns are deemed to be unacceptable, none of the experts reckon the gap is easy to close, or that there is a quick fix. But there is plenty of advice.
The simplest option is to raise tax. High earners have lower earnings. Gap narrowed. Simple. Until, that is, they take their earnings elsewhere.
Did you know? If Scotland were 100 people, 15 are below the poverty line - that is down from 21 in the mid-1990s.
Less simple is the option of raising low levels of income. That can be done by legislating for a higher minimum wage, and closing loopholes around it.
It can also be done through tax credits - using redistribution to reward those who work, while complementing their earnings to boost their spending power. Both have been used in the UK since 1997.
The welfare system plays a big role for lower-income families. Reforms of rules for claimants has a significant effect on how much money goes into households. The Scottish government is soon to have some powers to change those rules and compensate for changes made to welfare in Whitehall.
But be careful. If the redistribution goes too far, it can choke off growth and tax revenue. And that way, everyone ends up with less.
- Published10 November 2016

- Published12 November 2016
