GERS 2014-15: Seeing red in Scotland's public finances
- Published

The GERS report - Government Expenditure and Revenue Scotland
Time to get your tin helmet on. Just when the Holyrood election and a Europe referendum are looming, we get the GERS figures.
For those still fighting the referendum campaign on Scottish independence - and there seem to be a lot of you out there - this is a significant injection of new data.
Expect GERS (Government Expenditure and Revenue Scotland), external to be batted around a lot in the next year - that is, until the figures covering 2015-16 come out.
They are likely to look even less helpful to the independence cause.
How unusual is a deficit?
In short, Scottish public finances have been running a deficit. The figures for 2014-15 represent a rather large deficit.
Now, deficits are not unusual, and they are not necessarily bad. For governments, they're normal.
Overspend can be accommodated with the expectation of future growth in the economy. Capital spend is intended to help that future growth, with long term investment in public assets.
How big should a deficit be? In an economy that's growing fast, and sustainably so, governments can afford a bigger deficit.
What's an acceptable deficit?
3%
of GDP, says the eurozone, which the UK is not a part of
-
9.7% of GDP in Scotland, 2014-15
-
4.9% of GDP for the UK, 2014-15
But a useful benchmark for a developed, gradually-growing economy like Scotland's comes from the eurozone. The rules of that currency club state that government deficits should be no more than 3% of GDP (gross domestic product, meaning total economic output, and the usual way of comparing the apples and pears of economies).
In recent years, several eurozone countries have driven a coach and horses through that 3% rule. So has the UK. These have been exceptional times.
But the eurozone club expects its members to get deficits down to below that 3% figure. For some member countries, that discipline continues to be very painful.
So when GERS numbers point to a deficit of 9.7% of GDP, it's quite hard to present that as anything positive. It's more than three times bigger than the benchmark sustainably safe level.
And it's going up. Over the previous four years, 2010-14, the average net fiscal deficit (all spending and expenditure) was 8.3%.
The UK public finances continue to run a deficit above the eurozone guideline. But that's been falling. Last year, it was just over half the scale of the Scottish one - comparing the 9.7% in Scotland to 4.9% for the UK.
That's the number George Osborne wants to get down to zero by the end of this decade, so that he can start paying off debt. That downward pressure is where 'austerity' comes from.
Still in the red
Ok, so one thing you can do is to remove the capital spending element. That's if you want to argue that investment in future, growth-enhancing assets should not be included with current (or day-to-day or revenue) spending.
That's a reasonable thing to do. Does it help lower the deficit? A bit, of course. But not that much.
It still leaves Scotland in the red to the tune of £11.9bn. Convert that into a share of GDP, and Scotland has a 7.8% deficit, while the UK overspend is 3.3%.
So what's going on? There are lots of elements, but three important ones explain the change over recent years and the difference with the UK....
onshore tax revenue
the amount spent in Scotland per head
and the role of oil and gas tax revenue.
Onshore tax revenue (excluding oil and gas, that is) has been fairly close per head to that of the UK as a whole.
Scots contribute less than their UK population share (which is 8.3%) on taxes associated with wealth and assets; Capital Gains Tax and Stamp Duty, as well as National Insurance Contributions.
However, Scots are reckoned by statisticians to pay a bit more than their population share on VAT, and well over their share of tax on tobacco (13.1%), alcohol (9.2%), gambling (10.4%) and Air Passenger Duty (9.7%). (Make what you will of that list.)

GERS: Extracts from Table E.2 (figures rounded to the nearest £100). The numbers listed refer to the difference compared with the rest of the UK.

The reckoning on expenditure is that government - including Westminster, Holyrood, European and local - spends £12,800 per person in Scotland. That's £2800 more than the tax take per head.
The amount spent per head across the UK as a whole is £11,400. That's £1,400 more than tax take.
It's also, by coincidence, £1,400 less than is spent on the average Scot.
Or to put it another way, for every £128 spent by government in Scotland, £28 has to be borrowed.
Why is Scottish spending higher? Mainly because the spending formula is relatively generous. For every £100 spent per head on the average British person, another £12.30 is spent on the average Scot.
Scotland's tax contribution
On what goods and services do Scots pay more?
-
13.1% share of tax for tobacco
-
9.2% share of tax for alcohol
-
10.4% share of tax on gambling
-
9.7% share of tax on Air Passenger Duty
There are reasons for that. Sparse rural communities expect equivalent quality of health and schooling, and along with transport, that comes at a higher cost per head. Scotland also has special problems with the poor state of its health.
But that is not to say the allocation of funds through the Barnett Formula is based on need. It's based on precedent started in the 1970s, which was loosely linked to need at that time - since when the relative positions of different parts of the UK have changed (Scotland for the better).
And because it's politically very difficult to unpick that formula, it still guides the share of public spending across Scotland, Wales and Northern Ireland.
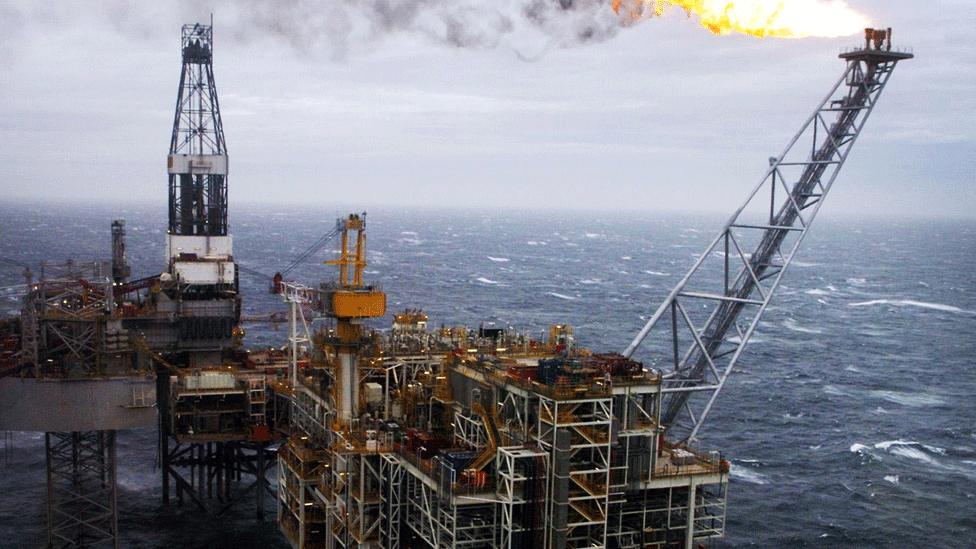
What about oil and gas tax?
There have been some bumper years recently.......
Between 2010 and 2014, the average UK tax was £7.6bn. In 2014-15, it fell to £2.26bn.
Translated into a share per head, the value of tax from fields in Scottish waters was worth £850 over the previous years.
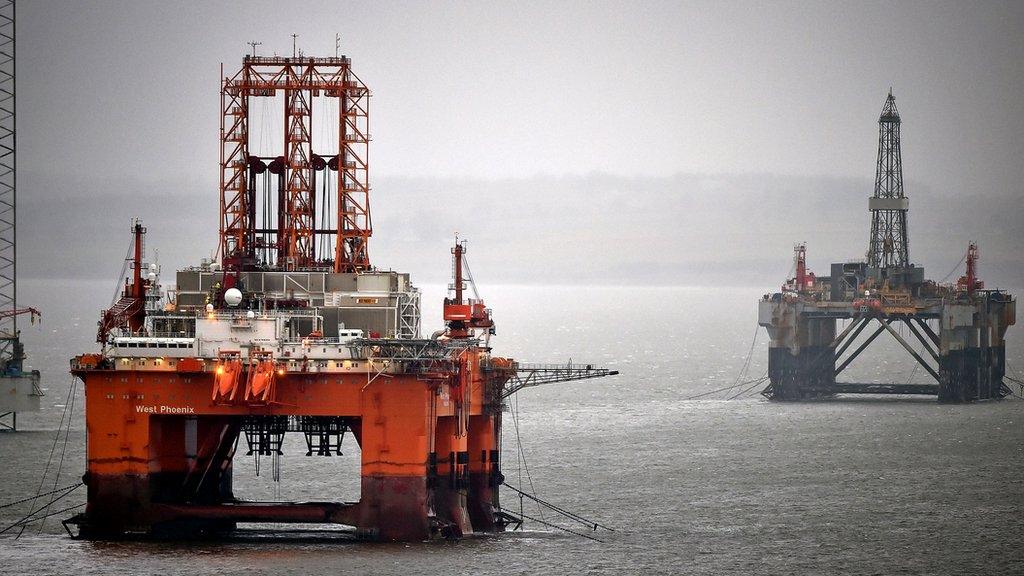
But investment was being poured in, much of which can be written off against tax. Production costs were rising rapidly, hitting profitability. And the price of both oil and gas started to fall during 2014-15.
So with lower revenue, the value per head has more than halved, to £400 per Scottish skull. It's only with that element added that Scotland gets close to the UK tax revenue average.
More tax cuts?
It's worth noting also that the share of the UK's total oil and gas revenue has fallen, from an average over 2010-14 of 86.5% to only 80%.
That's not because the oil fields have moved across boundaries, obviously. It is a calculation by academics at Aberdeen University, led by Professor Alex Kemp, which reflects the higher share of investment in Scottish offshore oilfields, meaning taxable profits from those fields are lower.
The other factor worth noting is that next year is almost certain to look even bleaker for Scotland's accounts.

The the revenue for North Sea oil dropped to £2.26bn for 2014/15
Those investment tax breaks and a much lower price together make a lot of the UK offshore sector unprofitable. The UK Exchequer expects to see a fall from only around £2.2bn last year to only £100m for this year, and each of the following two years, before it rises a bit.
That's the forecast from the Office for Budget Responsibility (OBR). It translates to revenue of less than £2 per head across the UK, and merely £16 per head if allocated to Scottish revenue.
The OBR will update those forecasts alongside the Budget next week. And if the advice of the oil industry and of the Scottish government is taken in compiling that Budget, there will be further tax cuts aimed at encouraging exploration for new reserves. At least for the next few years, that would mean even lower tax revenue.
- Published9 March 2016
