Election results 2017: Did the Scottish party leader visits pay off?
- Published
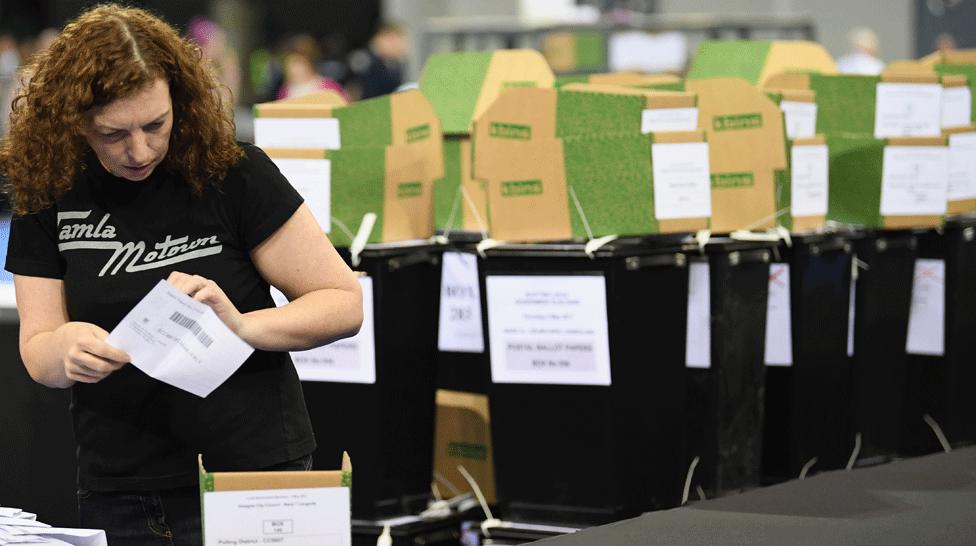
And the winners were? Counting for Scotland's 59 Westminster seats took place on Thursday night
Ahead of the 8 June election, BBC Scotland news looked at the campaign visits of Scottish party leaders to see if their road trips could tell us anything about how they might perform.

So how did we do? Was it worth getting the road atlas out?
The big (or at least middling-sized) idea was to look at where the leaders of the four main Scottish parties were campaigning.
Would where they were going tell us what mattered to them, any more than what they were saying?
My data journalism colleague Marc Ellison assiduously plotted the every move of Nicola, Ruth, Kezia and Willie. He used information from the parties and Twitter.
Naturally we larded the exercise with several caveats: we tracked them for only a limited time (so we had time to get our calculators out before polling day) and didn't count national events like manifesto launches.
Plus it was all - as they say - just a bit of fun.
Not only did we track each leader on the map, we filtered it further to the constituencies receiving the most visits from party leaders.
Hence we arrived at what I - and absolutely nobody else around here - dubbed the BBC Scotland Super Seven Seats To Watch.
Were they worth watching? Please excuse me if a certain smug glow tinges the following.
(I have dubbed this the maptermath but again no-one is biting.)
East Lothian went from SNP to Labour. Kezia Dugdale had visited several times, underlining her party's ambitions.
She'd also been a frequent campaigner in Edinburgh East. Here the SNP saw their share of the vote decline sharply but they still attracted more than enough votes to retain it. Kez could have saved a bit of shoe leather there.
Perth and Perthshire North was a squeaker. The Tories had high hopes, but the SNP held on by 21 votes.
Dunbartonshire East felt the love from both the SNP and Liberal Democrat leaders. The Lib Dems wrested it back from the SNP by an impressive margin.
Edinburgh West went from SNP to the Lib Dems.
Renfrewshire East was SNP, is now Tory.
Our top of the pops, though, was Fife North East: three recounts and an SNP hold by two votes. If you were one of the count staff in that one, I salute your indefatigability.
We'd love to say we called it right but it's not quite that simple.
Plus, it's undignified, ungainly and probably unsafe to try to do a lap of honour while slapping yourself on the back.
The reality is that three times as many Scottish seats changed hands.
The map revealed where the parties - especially the challengers - thought their best prospects lay.
But other upsets came straight out of left field - almost literally. Rutherglen and Hamilton West, anyone?
Time to learn lessons
Perhaps a Corbyn bounce. Perhaps a reversion to a voting pattern predicted last century by The Great Brian Taylor: that many urban voters might happily vote SNP for Holyrood, Labour for Westminster.
Perhaps both. The map doesn't tell us.
It does, however, teach us lessons.
Here's one: the position of the SNP going into this election made it a special case. The nature of the party's SNP's 56-seat tsunami last time meant the party was playing defence in all but three seats.
It was tempting to view each Sturgeon campaign visits as an attempt to shore up support for an incumbent under threat. One wag suggested that if an SNP candidate saw her turn up in their seat, she might as well have brought their P45 with her.
That turned out to be unfair: in the end Nicola had been to almost every constituency in the land. The ones she did not visit could be counted on the fingers of one hand.
The flipside of that meant the other parties could - and did - concentrate their resources on target seats.
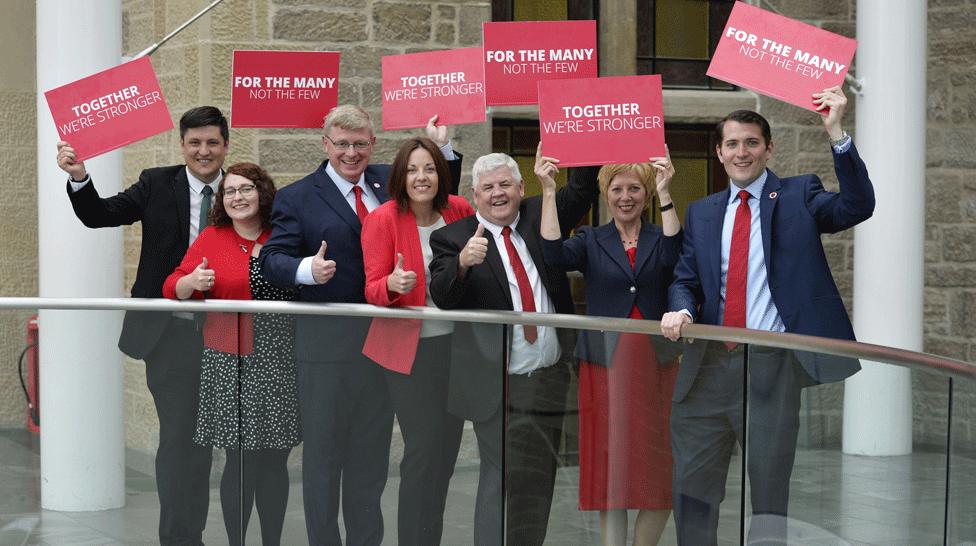
Kezia Dugdale with six of her sevenw MPs
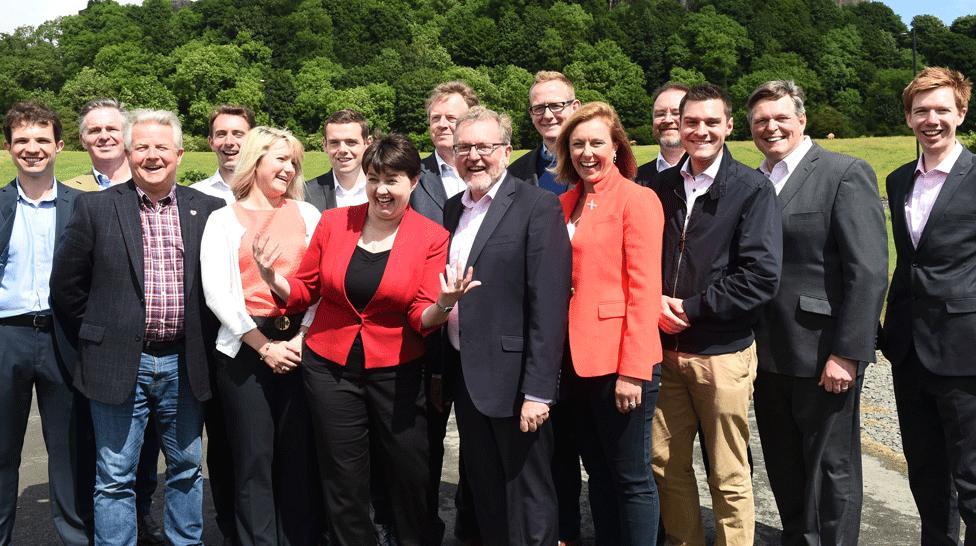
Ruth Davidson with the new Scottish Tory intake at Westminster
So where Ruth, Kezia and Willie went proved to be more of an indicator.
Watching the map of leader visits was an attempt to get under the hood of the campaigning process.
Next time - and I hope there will be a next time for this - we should watch the map even more closely, with more detail and a longer timescale.
But we will also have to get a better handle on the darker political arts: direct mail, social media, cold calling voters.
Listening to what the leaders say on the stump - and where they go - is only half the story. Maybe less than half.
To watch the map is to place oneself in a feedback loop. The decisions made about where a leader campaigns is only as good as the information they are getting.
How did we do?
Newsnight's policy editor Chris Cook writes how Theresa May campaigned in the wrong seats, trying to woo voters in what were seen as winnable Labour constituencies where the data suggested ex-UKIP votes might fall to her rather than back to Labour.
Cook calls it "The Tories' English polling catastrophe". That's not overstating it.
Why then did the Scottish Conservatives do so well relative to the Tory debacle down south?
As Cook points out, the Scottish Tories had a separate polling operation.
Better data drove better campaigning and better results. The SNP remain Scotland's dominant party but the Tories have had their best performance in decades.
The final analysis of our mapwatch? To use a technical term, we did OK.
It wasn't perfect and - whenever the next election is - we're bound to do better next time.
Then again, it was approximately a squillion times better than most opinion polls.
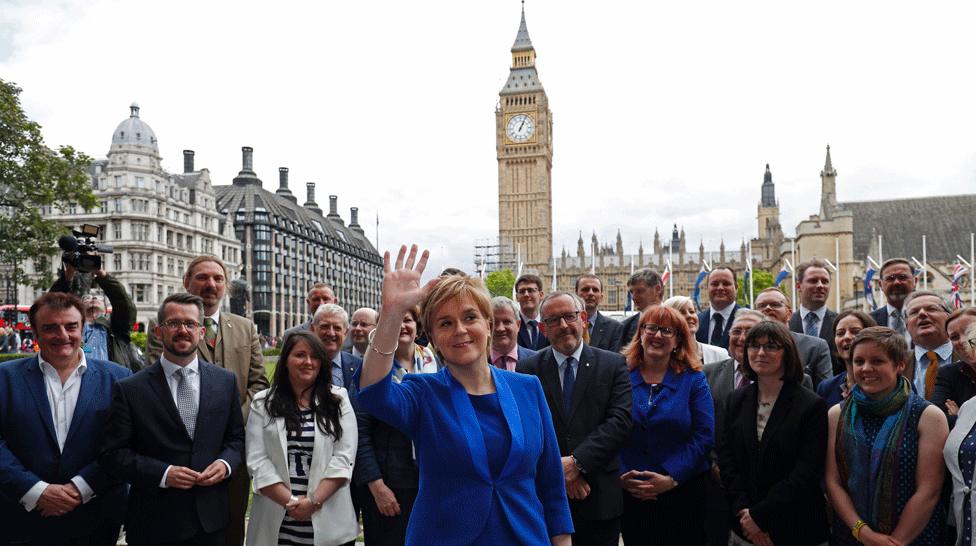
The SNP's Nicola Sturgeon with her "Class of 2017" at Westminster
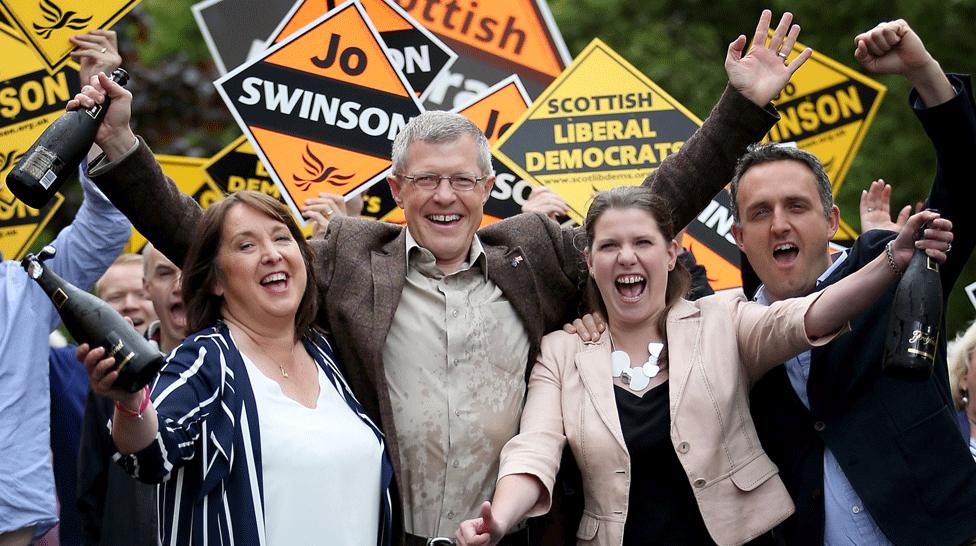
Willie Rennie celebrated the Scottish Lib Dems sending four Scottish MPs to Westminster

Map look back - (Not forgetting those caveats)
We looked only at the Scottish party leaders. We didn't count national events like manifesto launches and we set a time limit - from Monday 8 May to close of play on Friday, 2 June.
Sorry, your browser cannot display this map
Sorry, your browser cannot display this map
Sorry, your browser cannot display this map
Sorry, your browser cannot display this map