Coronavirus: Why are we looking at the 'R number' in Wales?
- Published

The R number has been called the biggest factor in determining when the lockdown will be eased
The rate that coronavirus is being transmitted in the community is being watched keenly by health officials.
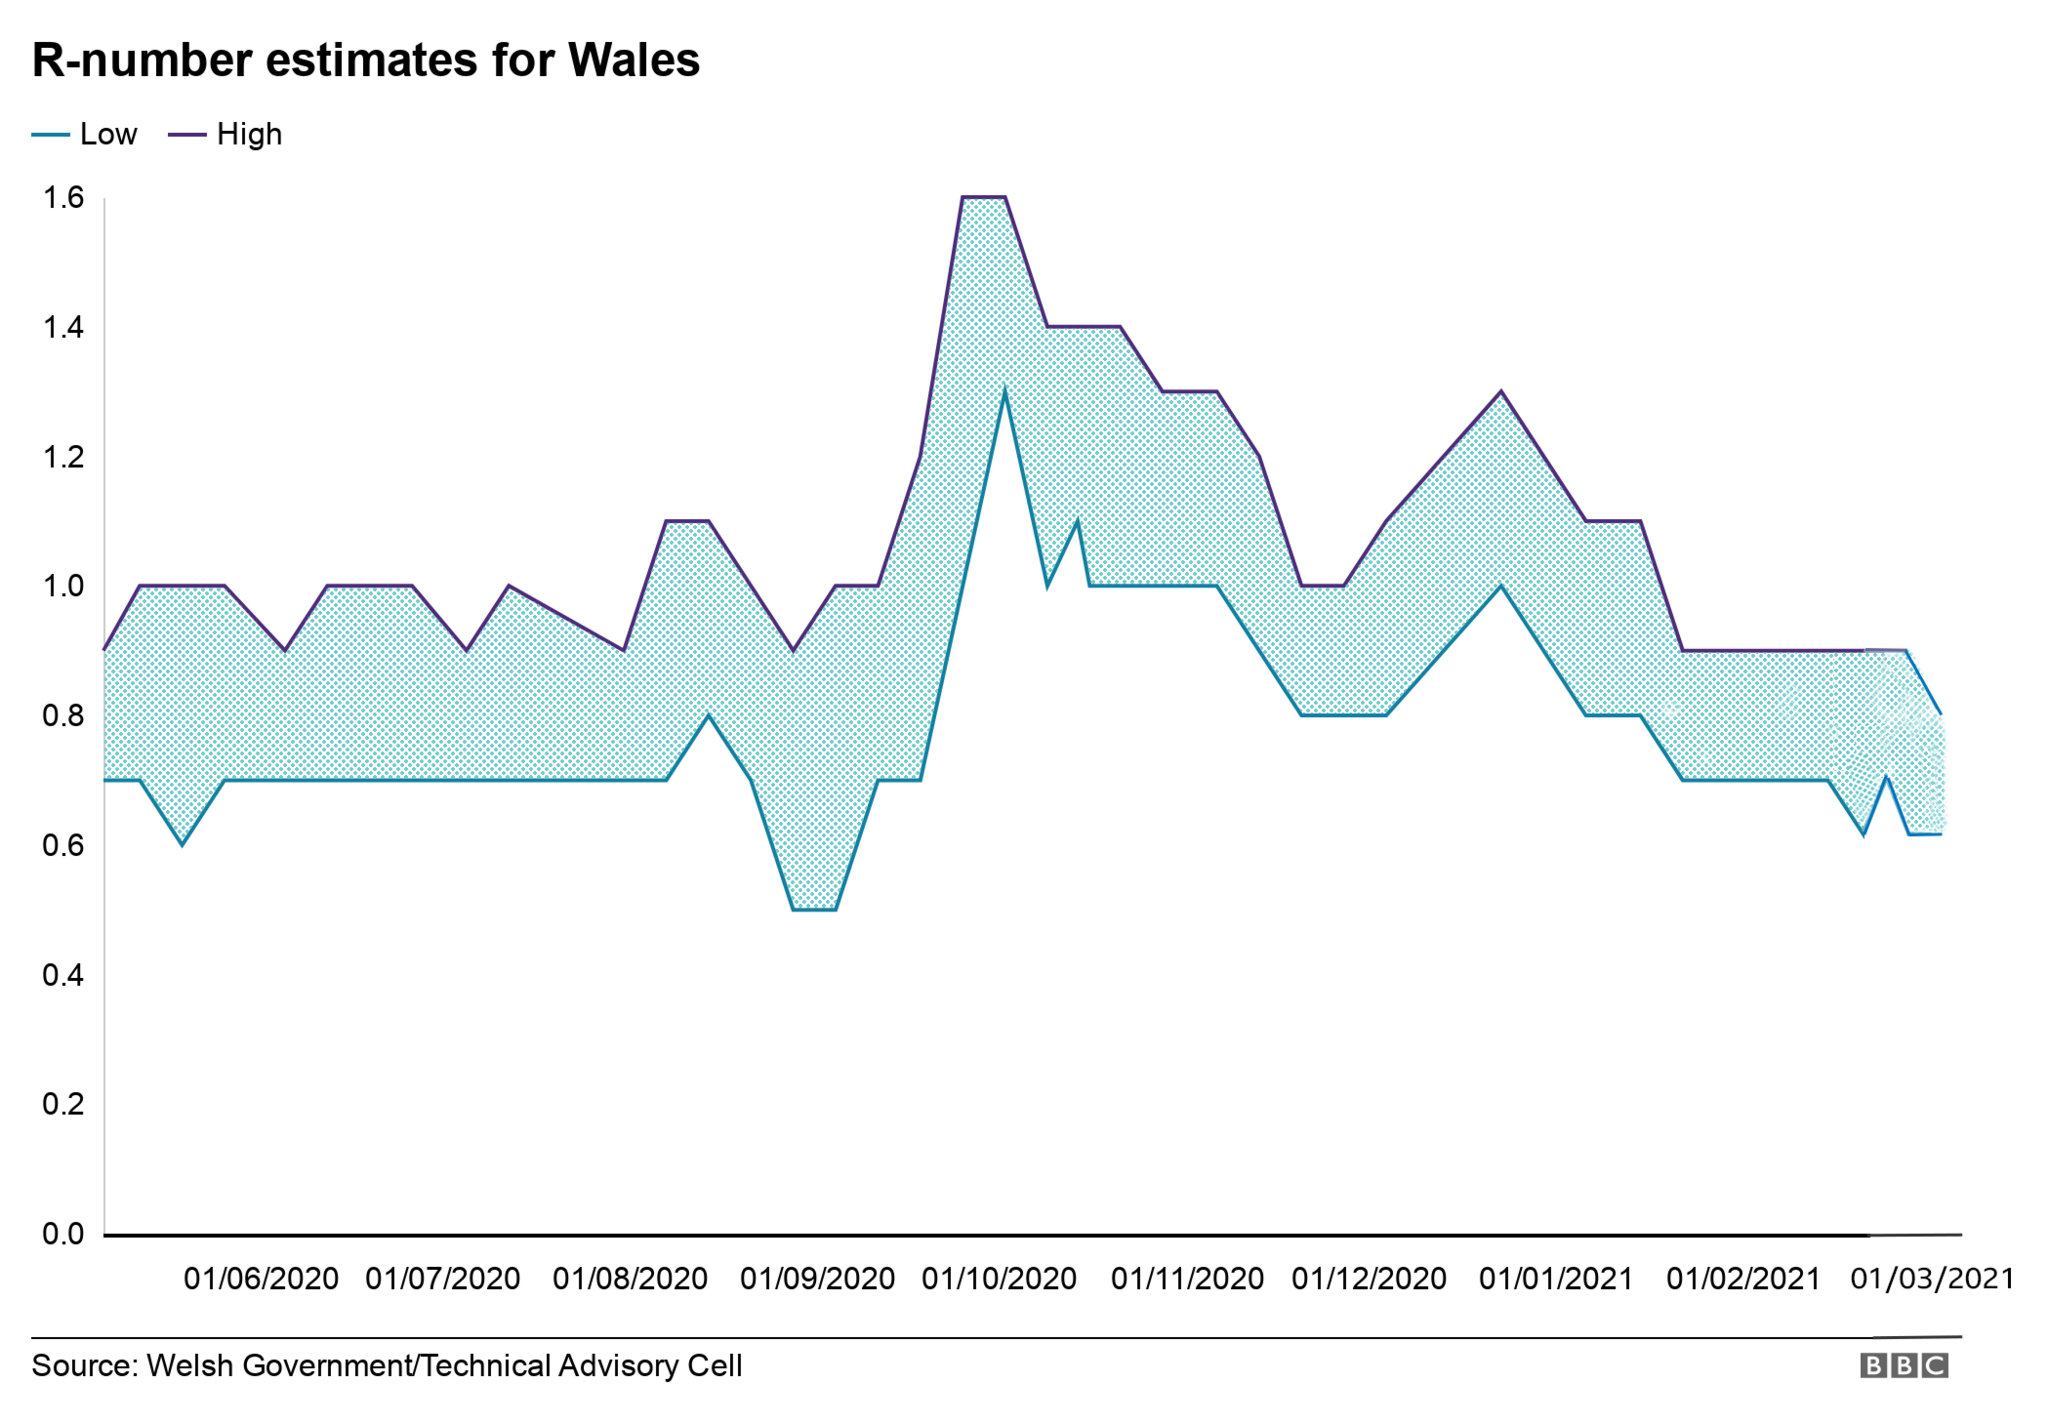
As of 19 March, the reproduction (R) number was within the range of between 0.6 and 0.9 according to the Welsh government's Technical Advisory Cell (Tac).
It had been within the range of 0.6 to 0.8, in the week earlier.
Based on case rates alone, Public Health Wales (PHW) estimated the R number to be 1.0. It estimates a growth rate of 0.5% per day but for those aged 60+ cases "appear to be shrinking at a rate of 2.8% per day" and a halving time of 25 days (the time it would take for cases to halve).
The latest R number means for every 10 people with the virus in Wales, it would mean about six to nine people would be infected.
The UK R-number is between 0.7 to 0.9.
What is the R number?
What is the R number and what does it mean?
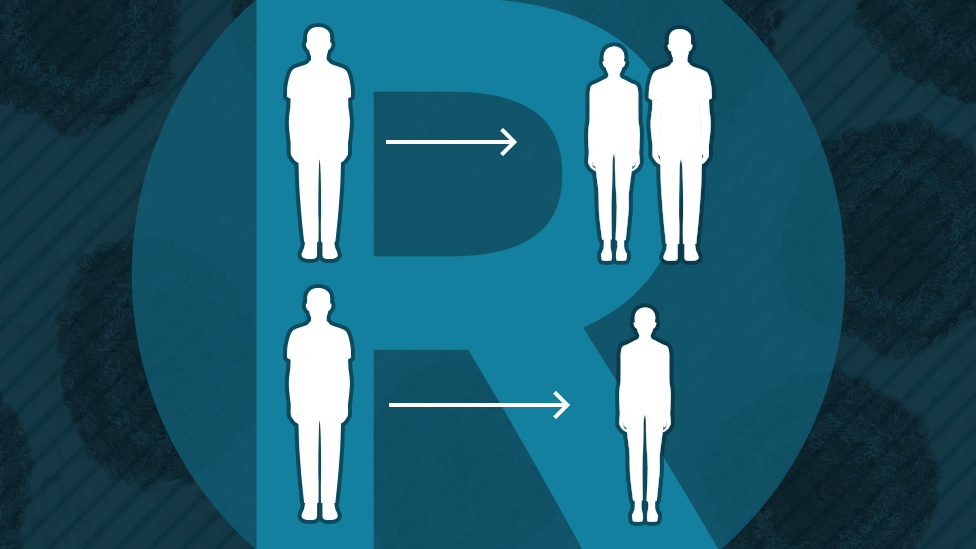
It tells us how many people are likely to get infected from a person who is ill with coronavirus.
So if the R number is two, it means a sick person is likely to transmit the virus to two other people. This is how coronavirus spreads.
The lower the number the better - and under one is the aim. As restrictions are lifted, it often leads to the R number rising.
So if R is 1 then, on average, 10 people infected with Covid-19 would pass it on to another 10 people.
But if R is 0.7 then, on average, 10 people who have caught coronavirus would pass it on to seven others, and so on.
What is the R number in Wales?
As of 19 March, it was estimated to be between 0.6 and 0.9, external and another estimate, made by Imperial College London,, external put it at about 0.85 on 22 March.
Scientists say the R number is useful when coronavirus cases are going up or down, but with a low numbers of cases - as over the summer - it was hard to get a good handle on what was happening.
So the lower the number of positive cases, the less useful it is.
When cases rise, the R number and growth rate are seen as more reliable tools again.
This is also why it is also unreliable to try to estimate a R number for different regions of Wales.
What else do we need to look at?
The R number plays into a number of "circuit-breaker" tests, which health officials and scientists are looking at.
The growth rate indicates that infections could be shrinking by between -6% and -3% per day.
Meanwhile, the ONS swab survey estimates that 6,700 people in Wales had Covid-19 in the week to 20 March, the lowest estimate since the start of October. This is down by about 300 on the previous week.
This is one in 450 people - down from one in 430 people, or 0.22%.
The R number in Wales is worked out by looking at eight different data sources - and it is then a weighted average of estimates.
This includes data from hospital admissions, confirmed cases, deaths and data from contact surveys, which includes a Welsh sample.
The number of people with confirmed Covid in hospital was declining, but remained high.
What else are the experts saying?
The Sage group of UK scientific advisers is also looking at the speed and how quickly infections are changing each day., external
In Wales, cases among people in their 20s have fallen by half but increased by the same proportion among the under 10s, in the latest week.
We can also see drops in cases among people in their 60s and 90s and a smaller decline in the 70s age group.
Mobility data for Wales also shows how lockdowns have changed behaviour - where we travel to, including trips to work and shops.
Tac reported mobility data showing Facebook users' movement was the highest since mid-December - pre-lockdown - whilst workplace mobility (from Google) was the highest since 18 December.
Related topics
- Published26 March 2021
- Published8 May 2020
- Published7 May 2020
- Published6 May 2020
