Premier League: How far did you travel this season?
- Published
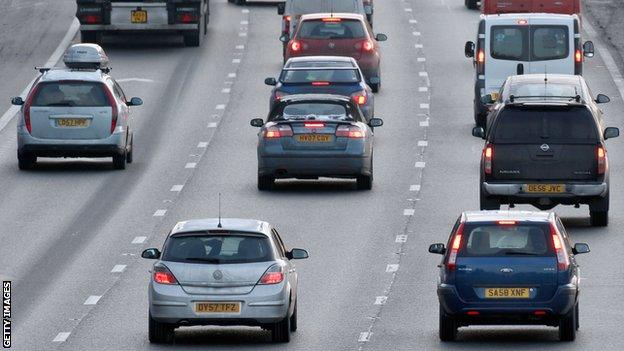
Football fans are known for showing unwavering commitment in backing their heroes - and Premier League clubs travelled a total of 57,000 miles to away matches across the 2014-15 season.
But whose mileage over the entire Premier League season could have taken them to the Caribbean islands of the Bahamas? Whose average trip was the same length as one complete loop of the M25 motorway? And who clocked up 1,718.2 miles before winning on the road?
BBC Sport finds out which supporters travelled the longest distance over the past nine months.
Which Premier League team travelled the most?
Travelling distance during the 2014-15 season | ||
|---|---|---|
Total miles | Average trip | |
Swansea | 4,129.3 | 217.3 |
Newcastle | 4,082.2 | 214.9 |
Sunderland | 4,007.9 | 211.0 |
Southampton | 3,390.7 | 178.5 |
Hull | 3,090.5 | 162.7 |
Crystal Palace | 2,937.7 | 154.6 |
Burnley | 2,830.5 | 149.0 |
West Ham | 2,758.9 | 145.2 |
Chelsea | 2,709.1 | 142.6 |
Tottenham | 2,696.7 | 141.9 |
Liverpool | 2,668.8 | 140.4 |
Everton | 2,666.4 | 140.4 |
QPR | 2,644.6 | 139.2 |
Arsenal | 2,617.1 | 137.7 |
Man City | 2,548.6 | 134.1 |
Man Utd | 2,436.3 | 128.2 |
Stoke | 2,287.8 | 120.4 |
West Brom | 2,206.1 | 116.1 |
Leicester | 2,198.3 | 115.7 |
Aston Villa | 2,117.9 | 111.5 |
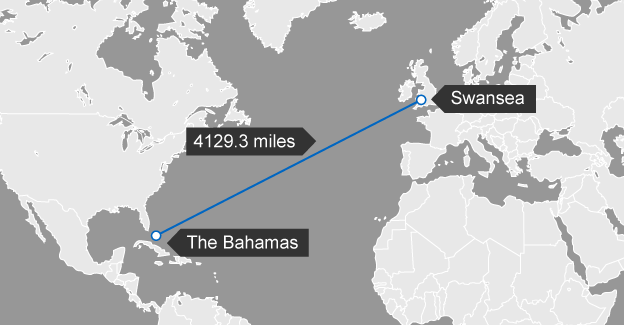
Swansea's total mileage of 4,129.3 could take fans on a one-way trip to the Bahamas...
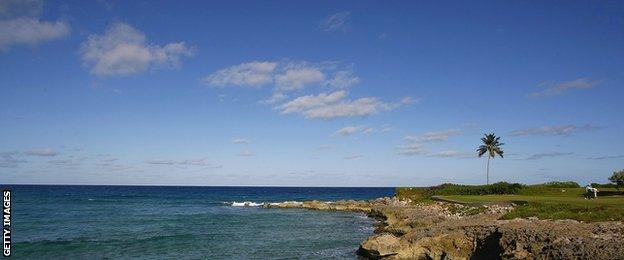
...and see fans of the Swans luxuriating on the islands' beaches

Who had the longest trip in the Premier League?
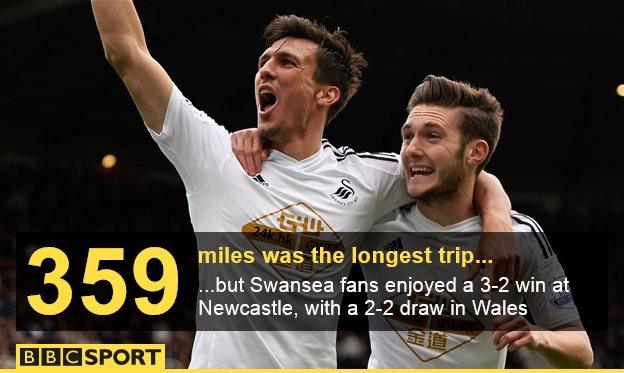
Swansea and Newcastle supporters faced the longest trek in the Premier League when their sides met - a journey of 359.4 miles. And trips to the Liberty Stadium and St James' Park were particularly arduous for the majority of top-flight fans.
That is because Swansea and Newcastle accounted for the longest awayday for 18 of the 20 teams. The other two? Southampton was the longest trip for both Everton and Liverpool.
Who had the shortest trip?
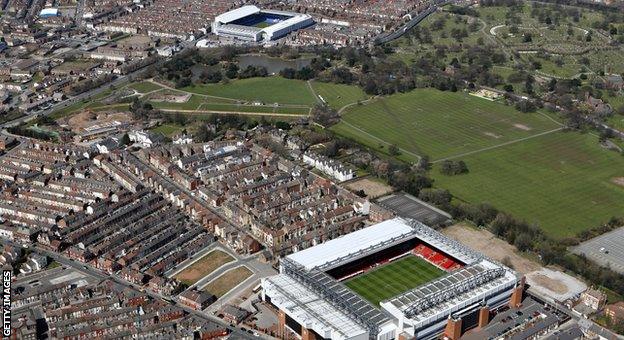
Everton's Goodison Park and Liverpool's Anfield are separated by Stanley Park
The shortest away trip in the Premier League, calculated by road distance, is the 1.2 miles between Liverpool and Everton.
British middle-distance athlete Mo Farah could run that journey in about four minutes 55 seconds - and even quicker, of course, if he dashed the more direct route across Stanley Park.
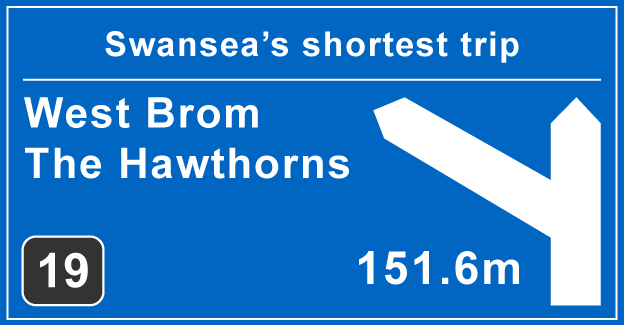
Swansea's shortest journey was the 151.6-mile trip to 'nearest rivals' West Brom. A single trip from Swansea to The Hawthorns equals 40 return trips for the Baggies to their nearest neighbours Aston Villa
Who faced miserable trips home?
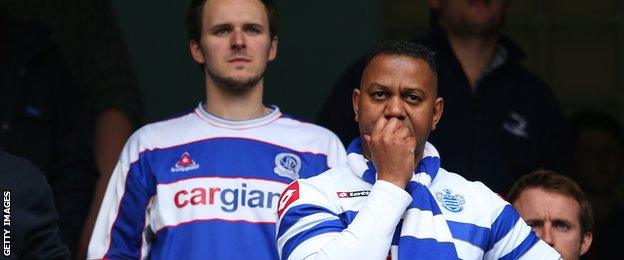
It was mainly misery on the road for fans of QPR - but they eventually won 2-0 at Sunderland
QPR fans had a miserable season as the Hoops were relegated back to the Championship after just one season.
And they travelled 1,718.2 miles before seeing their side win away from home for the first time in 2014-15.
The west London club finally won at Sunderland - an individual trip of 318.2 miles - in their 13th away match in all competitions, on 10 February.
Who were the happiest travellers?

Jose Mourinho's Chelsea won 11 away games, scoring 37 goals in the process
Chelsea fans had plenty to cheer about as their team won the Premier League and League Cup. And return journeys back to the capital, including trips to Sporting Lisbon, Maribor and Schalke in Europe, were made even sweeter in the early part of the season.
That is because the Blues travelled 3,934.1 miles before seeing their team lose away from home for the first time this season.
Their first away defeat in all competitions came in their longest Premier League trip - the 285-mile journey to Newcastle on 6 December - in their 12th match on the road.
Who gets the best value?
Miles per goal during the 2014-15 season | |||
|---|---|---|---|
Total miles | Away goals | Miles per goal | |
Man City | 2,548.6 | 39 | 65.3 |
Chelsea | 2,709.1 | 37 | 73.2 |
Arsenal | 2,617.1 | 30 | 87.2 |
Tottenham | 2,696.7 | 27 | 99.9 |
Crystal Palace | 2,937.7 | 26 | 113 |
Man Utd | 2,436.3 | 21 | 116 |
Liverpool | 2,668.8 | 22 | 121.3 |
Leicester | 2,198.3 | 18 | 122.1 |
Everton | 2,666.4 | 21 | 127 |
QPR | 2,644.6 | 19 | 139.2 |
Stoke | 2,287.8 | 16 | 143 |
West Ham | 2,758.9 | 19 | 145.2 |
West Brom | 2,206.1 | 14 | 157.6 |
Aston Villa | 2,117.9 | 13 | 162.9 |
Southampton | 3,390.7 | 17 | 199.5 |
Burnley | 2,830.5 | 14 | 202.2 |
Swansea | 4,129.3 | 19 | 217.3 |
Hull | 3,090.5 | 14 | 220.8 |
Sunderland | 4,007.9 | 15 | 267.2 |
Newcastle | 4,082.2 | 14 | 291.6 |
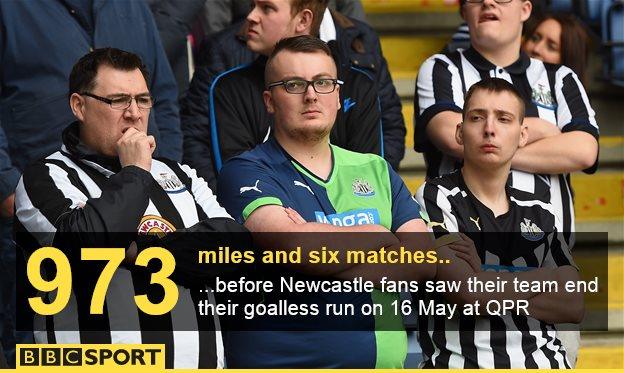
Newcastle did not net at Man City, Everton, Sunderland, Liverpool or Leicester from 21 February to 16 May
Brits abroad
European trips for Premier League clubs | |||
|---|---|---|---|
Total miles | Matches | Average trip | |
Tottenham | 6,822.05 | 5 | 1,364.41 |
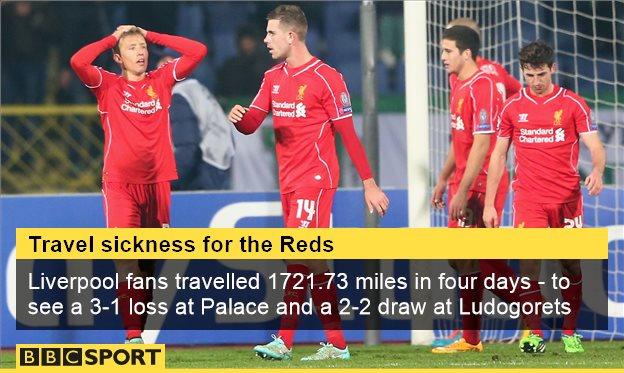
Liverpool | 4,630.53 | 4 | 1,157.63 |
Man City | 4,194.07 | 4 | 1,048.52 |
Everton | 4,907.39 | 5 | 981.48 |
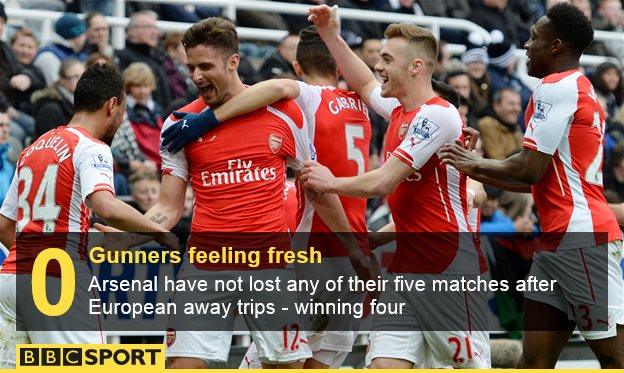
Arsenal | 4,271.74 | 5 | 854.35 |
Chelsea | 2,298.35 | 4 | 574.59 |
Hull | 1,115.67 | 2 | 557.84 |
Record after European away trips | ||||
|---|---|---|---|---|
Played | Won | Drawn | Lost | |
Tottenham | 5 | 2 | 0 | 3 |
Liverpool | 4 | 2 | 0 | 2 |
Man City | 4 | 2 | 1 | 1 |
Everton | 5 | 2 | 1 | 2 |
Arsenal | 5 | 4 | 1 | 0 |
Chelsea | 4 | 2 | 2 | 0 |
Hull | 1 | 0 | 1 | 0 |
All UK mileage calculated using the most direct road route between each club's stadium. One-way systems, roadworks etc mean distances between two clubs can vary in different directions. All European mileage calculated using flying distance between the two cities.
Graphics produced by BBC Sport's Ashleigh Jackson
- Published27 May 2015

- Published27 May 2015

- Published26 May 2015
- Published20 June 2016

- Published7 June 2019

- Published2 November 2018
