Premier League: 'Expected goals' tells us whether a player really should have scored
- Published

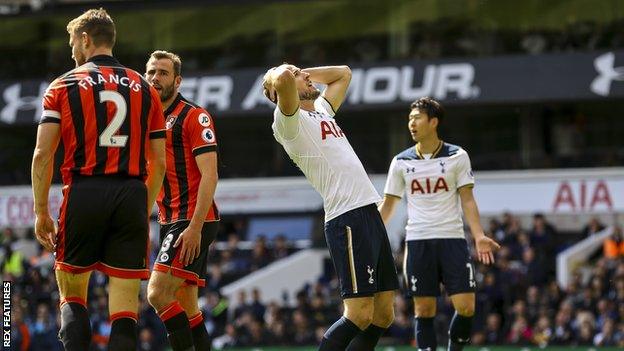
Despite this miss, Harry Kane was the Premier League's top scorer and most lethal finisher last season
"He's got to score from there!" "He should have had a hat-trick!" "He couldn't miss that!"
We've all said or heard these things while watching games, but is our frustration at missed opportunities justified?
Quite possibly not, according to a new method for analysing chances - "expected goals" - which is being used more and more by Premier League clubs.
Expected goals - what is it?
Did you know, only about one in every nine shots in the Premier League ends up as a goal?
And even relatively clear-cut chances are not scored as regularly as you might think.
"Expected goals" is a metric which assesses every chance, essentially answering the question of whether a player should have scored from a certain opportunity.
Put simply, it is a way of assigning a "quality" value (xG) to every attempt based on what we know about it. The higher the xG - with 1 being the maximum - the more likelihood of the opportunity being taken.
So if a chance is 0.5xG, it should be scored 50% of the time.
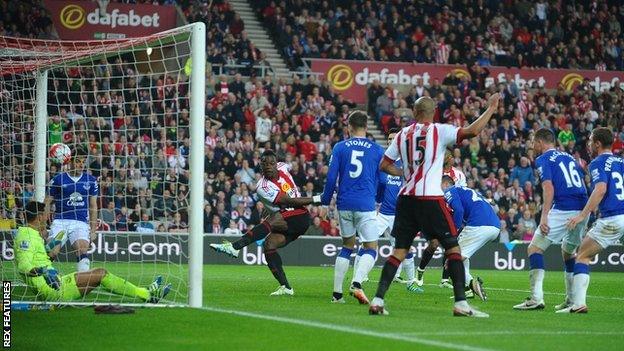
In the image below, Lamine Kone's effort from less than six yards out for Sunderland against Everton was 0.91xG. It was such a good chance it should be scored 91% of the time.

Even Sunderland couldn't miss a chance as good as this one
How is it worked out?
Football data experts Opta have analysed over 300,000 shots to calculate the likelihood of an attempt being scored from a specific position on the pitch during a particular phase of play.

The factors taken into account when assessing the quality of a chance include:
Distance from goal
Angle of the shot
Did the chance fall at the player's feet or was it a header?
Was it a one on one?
What was the assist like? (eg long ball, cross, through ball, pull-back)
In what passage of play did it happen? (eg open play, direct free-kick, corner kick)
Has the player just beaten an opponent?
Is it a rebound?
So should these chances have been scored?
Have a look at the following attempts and see if you can work out the percentage chance of them ending up as goals - and therefore whether you're right to say: "He should have scored."

Some of your information will be collected when you play this quiz. Click here to find out more.
So what? Why is this important?
The expected goals value reveals a number of things.
First, it tells us whether a chance really is as good as we think. While that has previously been a matter of opinion - one Match of the Day pundit might disagree with another - we can now say with some certainty whether an opportunity should have been taken.
In fact, you will start to see this being used in some of Match of the Day's analysis during 2017-18.
The metric also tells us how many goals an individual player should be scoring from the chances they have.
So a striker might be top of the scoring charts, but does that necessarily mean he is the best finisher in the league?
In the past we might simply have looked at who had the best conversion rate (how many of their chances ended up as goals), but this did not provide the whole picture, as someone with a high conversion rate might just be the beneficiary of their team creating really clear-cut chances.
Here's how the Premier League's leading scorers performed last season in comparison with their expected goals value.
All the leading players, except Manchester City's Sergio Aguero, scored more than the stats suggested they should have, underlining their status as expert finishers, even when in difficult positions.
And the player who outperformed the number of goals they were expected to score by the biggest margin? Harry Kane.
Which player was the best finisher in the Premier League last season? | |||
|---|---|---|---|
Player | Goals | Expected goals | Expected goals difference |
Kane (Tottenham) | 29 | 18.59 | 10.41 |
Lukaku (Everton) | 25 | 15.32 | 9.68 |
Llorente (Swansea) | 15 | 7.09 | 7.91 |
Son (Tottenham) | 14 | 6.73 | 7.27 |
King (Bournemouth) | 16 | 9.56 | 6.44 |
Only includes players with a minimum of 50 shots | |||
Conversely, it also allows us to say with a degree of certainty which players are most wasteful in front of goal.
And the worst? | |||
|---|---|---|---|
Player | Goals | Expected goals | Expected goals difference |
Tadic (Southampton) | 3 | 6.66 | -3.66 |
Arnautovic (Stoke) | 6 | 8.87 | -2.87 |
Mahrez (Leicester) | 6 | 8.83 | -2.83 |
Arter (Bournemouth) | 1 | 3.58 | -2.58 |
Rooney (Man Utd) | 5 | 7.3 | -2.3 |
Only includes players with a minimum of 50 shots | |||
Does it tell us anything else?
As well as helping us to assess player performance, expected goals also enables us to judge teams - and to predict future performance.
Take Juventus in 2015-16, for example.
They won only three of their opening 10 games but their expected goal difference throughout that run was much higher than their actual goal difference.
That suggested they were dominating matches and creating chances - they just weren't taking them.
It would have provided some comfort for Juve's backroom team, who would have been able to surmise that their performances were better than their results suggested.
And so it proved.
"To the naked eye they were struggling, but xG was identifying a team that would improve soon," said Duncan Alexander, Opta's chief data analyst.
"Lo and behold, around matchday 12, their fortunes changed, with the team starting to score at - and above - the expected rate. This led to them actually performing better than their xG said they should have in their eventual stroll to the title."
So if your team is performing above or below expectations at the start of the new season, a look at their expected goals difference could tell you whether that run is likely to last.
And it may also be something worth thinking about the next time your striker misses what you always thought of as an easy chance.
- Published8 August 2017
- Published7 August 2017

- Published10 August 2017
