School league tables explained
- Published

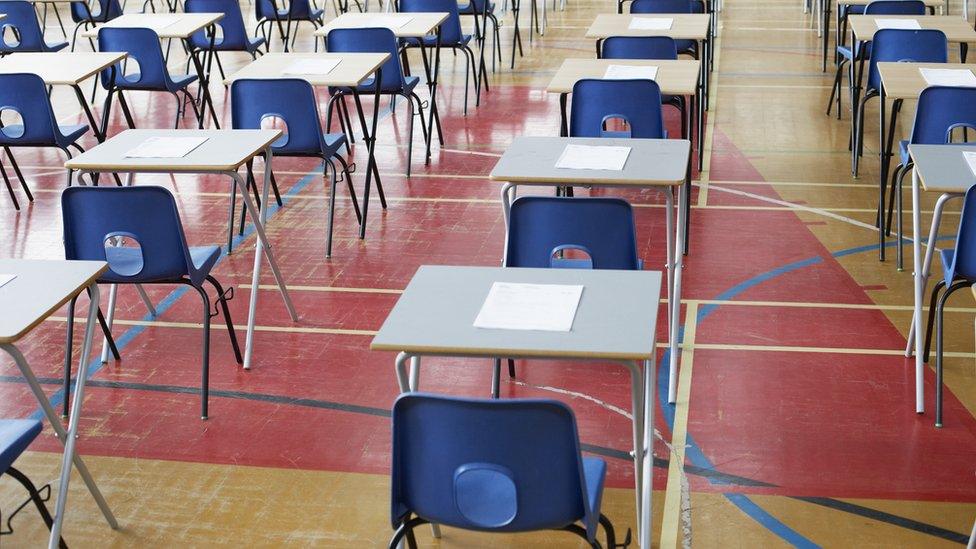
League tables are based on public exams taken at the end of primary and secondary school
The BBC News website looks at key questions about the publication of school performance data in England.

What is school performance data?
School performance data is statistical information showing how well pupils in England have done in public examinations taken at key points in their educational journey.
School league tables explained
Data is published for children's attainment in national curriculum tests, often known as Sats, which are sat at the end of primary school at age 10 or 11.
At secondary school level, data is published detailing pupils' performance in GCSEs (and equivalent exams) at age 16 and A-levels (and equivalents) at age 18.

What is considered to be acceptable performance at secondary level?
Secondary schools are considered to be "underperforming" if fewer than 40% of their pupils get five GCSEs at grade A*-C, including English and maths, and if the school has a below average score for pupils making the expected progress between Key Stage 2 (end of Year 6) and Key Stage 4 (end of Year 11) in English and maths.
Only a pupil's first attempt at a qualification is included for league tables - this aims to stop schools repeatedly entering pupils for exams in order to boost their ranking.
The list of qualifications included for league tables includes only those the government says are of the highest, academic quality, and the number of non-GCSE qualifications that count is capped at two.
Aren't there changes afoot for secondary tables?
Yes. From next year, schools in England will be measured on what is known as Progress 8, external. Progress 8 will replace the five or more good GCSEs, including maths and English, benchmark as the key measure for all secondary schools.
Progress 8 assesses the progress pupils make between Key Stage 2 tests taken at the end of primary school and their performance in a specified mixture of eight subjects at the end of secondary school. Schools will be given a score based on how their pupils have progressed compared to the national average.
This year, schools were given the option to "opt in" for Progress 8 and 327 schools (around 10%) took this up.

Primary school accountability focuses on the "3Rs"

What is considered to be acceptable performance at primary level?
Primary schools are considered to be "underperforming" if fewer than 65% of pupils get a Level 4 in maths, reading and writing, and pupils are not making the expected progress in these three subjects between the end of infants (age six or seven) and age 10 or 11, when they prepare to leave primary school.

How is the performance data presented?
In the past, only media organisations used the data to produce rankings in the form of school league tables.
But now the Department for Education effectively publishes tables, with a facility on its website, external that allows users to rank schools by different measures.

Schools are measured according to pupils' performance and progress

What happens in the rest of the UK?
Wales and Northern Ireland abolished league tables in 2001, followed by Scotland in 2003.
Scottish exam data is still published online, but it is not in a format where schools can be easily compared.
Wales now publishes tables that place schools in one of five performance bands.

What are the arguments for presenting performance data in this way?
The performance data in league tables is used widely by parents to judge how well schools in their area perform.
Supporters argue the tables help drive up standards by increasing the accountability of schools and providing valuable information for parents.
Research carried out by Bristol University suggested the abolition of league tables in Wales had led to a drop in standards in the lowest 75% of schools.

It is always advisable for prospective parents and pupils to visit a school

What are the arguments against?
Opponents say comparing schools in this way is too crude a measure of a school's quality, achievements and character.
They argue the tables often say more about the intake of a school than the teaching and learning that goes on there.
Increasingly, head teachers say the constant state of flux in the exams system makes comparisons between previous years less meaningful.
League tables are also thought to encourage competition rather than collaboration between schools in local areas and to lead to middle-class parents pushing to get their children into top schools, further driving down standards at less popular schools.
There are also suggestions children are pushed into subjects and choices that make the school look good, rather than broadening their education.
Should I choose a school for my child based on this performance data?
The tables show how well a particular year group of pupils at a given school has performed in tests or exams.
Most of the pupils will have started school a few years before taking the tests or exams, and there may have been changes of staff or policy at the school in the interim.
The tables do not include information about the more holistic elements of a school such as extra-curricular activities on offer - for example, sport and drama - or details about a school's pastoral care system.
Some of these details may feature in the school's Ofsted report.
It is always advisable to visit a school - most schools run open days or evenings for prospective pupils and parents.