Why has the year 2014 been so hot?
- Published

This year seems to be on track to be the hottest globally and in the UK. But what does this mean and what are the wider implications?
Where do the figures come from?
For the UK, the Met Office operates weather stations around the country and collects time-series data that show variations in the temperature over months, seasons and years.
For the UK, the mean temperature from 1 January to 25 November is 1.6°C above the long-term average.
That means 2014 is currently the warmest in the Met Office UK series dating back to 1910.
This year is also set to be one of the warmest on record in the Central England Temperature (CET) series, which goes back to 1659 and is the longest instrumental temperature series in the world.

The World Meteorological Organization (WMO) also says 2014 is on track to be the warmest globally.
According to the body, this is largely due to record high global sea surface temperatures.
The WMO is the UN's authoritative voice on global weather and climate.
Both the Met Office and the UN organisation say that the observed temperatures are consistent with what would be expected from human-induced climate change.

What data is used to analyse global temperatures?
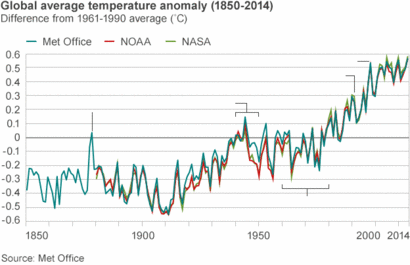
The WMO's analysis is based on three complementary datasets. One is maintained by the UK Met Office's Hadley Centre and the University of East Anglia (UEA) which is known as HadCrut4.
The second is overseen by the US space agency Nasa and is known as the Nasa GISS dataset.
The third is maintained by the US National Oceanic and Atmospheric Administration (Noaa).
Overall, they show a very similar story, but there are differences between them - mainly to do with the way that each group treats gaps in the data.
What else can affect variation in global temperatures?
Record warm years in the global temperature record are frequently associated with the temporary warming influence of the climate system known as El Nino.
El Nino occurs when warmer than average sea surface temperatures in the eastern tropical Pacific combine, in a self-reinforcing loop, with atmospheric pressure systems. This can affect global weather patterns.
-
×

-
1878: Strong El Nino
×In 1878, there was a strong El Nino (where warmer water rises to the surface of the Eastern Pacific Ocean) and this is seen very clearly as a large spike in global temperature. This event was remarkable for an extreme drought in India where it is an estimated more than five million people died. There were droughts in nothern China also associated with this El Nino. The famine caused by the drought in India spurred scientists to begin work on climate patterns, leading eventually to discovery of the El Nino-related “Southern Oscillation” - the idea that the ocean and atmosphere are connected.
-
1940s: Weaker El Nino
×The warm early 1940s were affected by a weaker, but protracted, El Nino.
-
1991: Mt Pinatubo eruption
×In June 1991 Mt Pinatubo in the Philippines erupted, releasing millions of tons of sulphur dioxide into the atmosphere. This resulted in a decrease in the temperature worldwide.
-
1998: Record-breaking year
×For a long time. the strong El Nino around 1997/98 meant that 1998 topped the rankings for the world’s warmest year. This has since been overtaken.
-
1960/70s: Cooler years
×The cool 1960s and 1970s are likely to have resulted at least partly from man-made air pollution from sulphate particles. Steps taken towards cleaner air resulted in warming.
But the high global temperatures in 2014 occurred in the absence of a full El Nino. During the year, sea surface temperatures rose nearly to El Nino thresholds but this wasn't accompanied by an atmospheric response.
Scientists think the persistence of above average temperatures in the tropical west Pacific Ocean stifled the atmospheric response that is necessary for an El Nino to mature.

Uptake of heat by the Pacific may be behind the "pause" in global warming
I thought there was a pause in global warming?
Global mean surface temperatures rose rapidly from the 1970s, but were relatively flat over the 15 years prior to 2013.
Many studies have reinforced a link between uptake of heat by the oceans and the "pause".
The high surface temperatures of the Pacific and other parts of the world's oceans might suggest that the pause is coming to an end, but there is no evidence yet to support this.
Climate scientists need more than one warm year to discern underlying trends.
A year of extremes

The frequency and severity of wildfires is expected to increase as temperatures rise
The WMO report highlights a number of record-breaking weather events around the world:
The UK's last winter in which 12 major Atlantic storms battered the country bringing nearly double the usual rainfall.
In September, parts of the Balkans received more than double the monthly rainfall and parts of Turkey were hit by four times the average.
The town of Guelmin in Morocco was swamped by more than a year's rain in just four days.
Western Japan saw the heaviest August rain since records began.
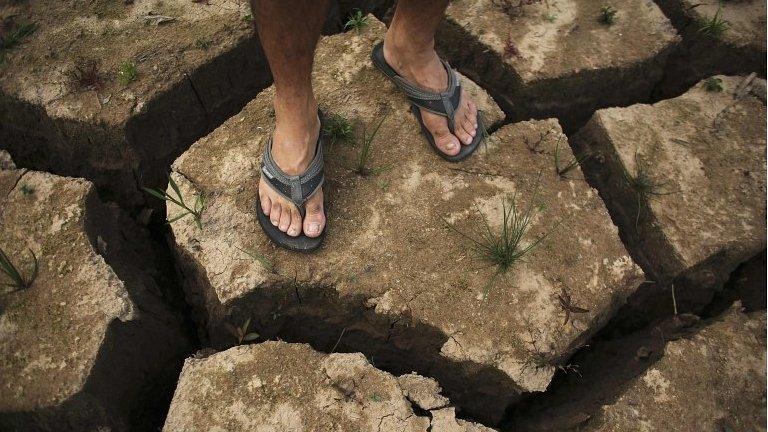
Parts of the western United States endured persistent drought (as we reported from Oklahoma last June, as did parts of China and Central and South America.
Tropical storms, on the other hand, totalled 72 which is less than the average of 89 judged by 1981-2010 figures. The North Atlantic, western North Pacific and northern Indian Ocean were among regions seeing slightly below-average cyclone activity.
- Published4 December 2014
- Published3 December 2014