Rain or shine: Watching the weather for 250 years
- Published
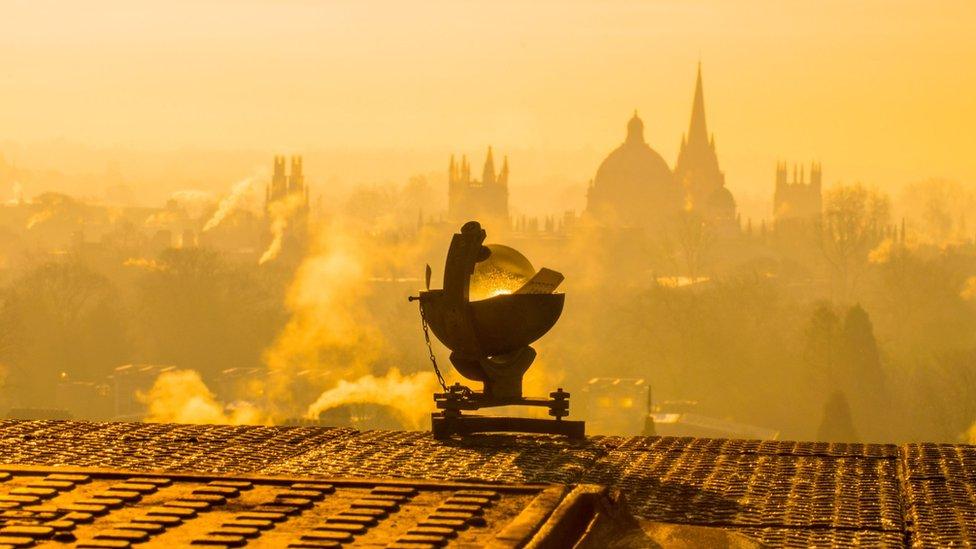
A Campbell-Stokes sunshine recorder: Oxford's sunshine record goes back to February 1880
Come rain or shine, come howling gale or thick fog - Oxford doctoral student Emma Howard must keep her 09:00 appointment. Two hundred and fifty years of history demand it.
Emma is one of the data recorders who manually reads off the weather instruments positioned on the lawn next to the Radcliffe Observatory in Green Templeton College.
If she can't do it, a colleague must.
Temperature on this spot has been measured every single day since Sunday, 14 November 1813, making it the longest, unbroken, single-site time series of its kind in the British Isles, and one of the longest in the world.
"It's fantastic to be involved with the Radcliffe record, but I'm also terrified of something going wrong and messing up this wonderful thing," she says.
"On the other hand it's really exciting to have this long record and then find the 'highest ever this' or 'the highest ever that'. We had a few of those last year."
Meteorology at the Radcliffe actually goes back even further than 1813, to the pioneering studies of Prof Thomas Hornsby.
Stephen Burt: "The Radcliffe record is a time machine back to Georgian weather and climate"
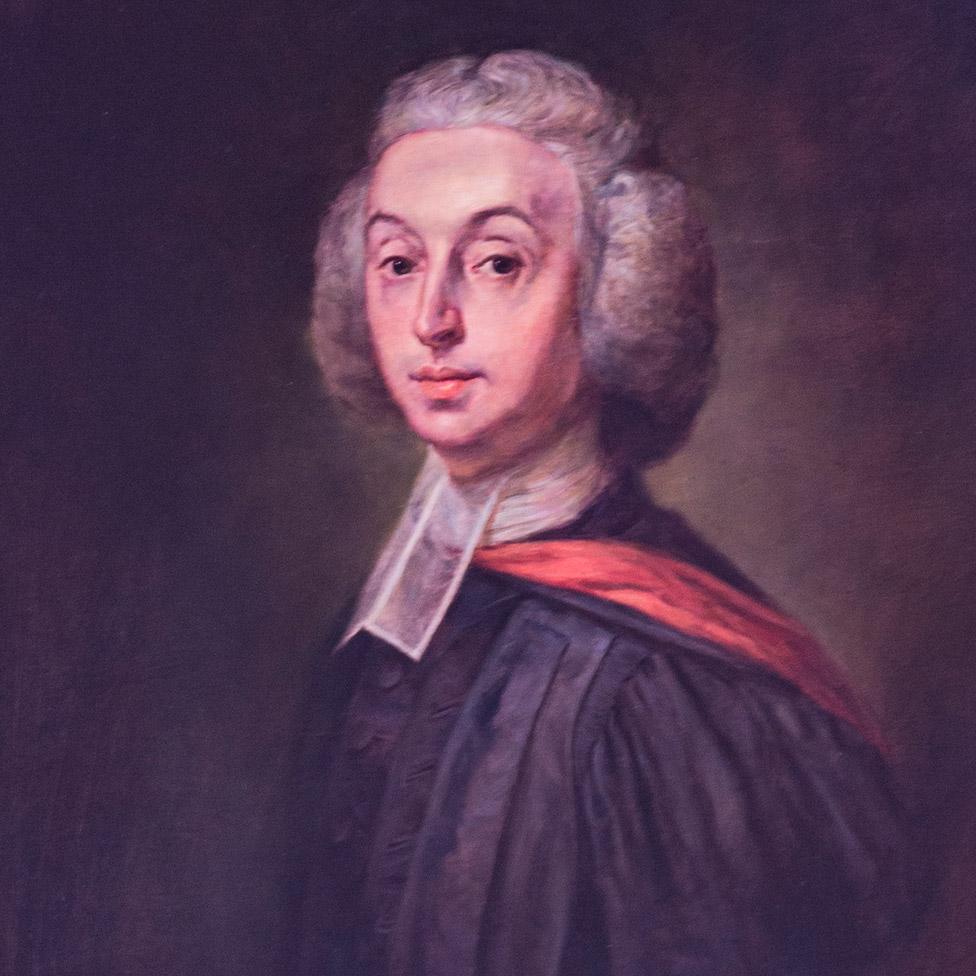
Thomas Hornsby started the weather observations to aid his astronomy work

He was the Oxford scholar who, in 1767, petitioned the Radcliffe charitable trust to build the majestic Observatory on the Woodstock Road heading north out of the city.
Hornsby was an astronomer - he was interested in the heavens. But to view the stars properly he needed to make corrections for atmospheric disturbance, and that meant keeping a keen eye on the weather as well.
Some of his early documentation has been lost, and in the twilight of his career, Hornsby also got a bit haphazard in his observations. But the monthly rainfall totals he started are continuous from 1767.
The precipitation gauge is fairly straightforward to read off, says Emma - except when it's been choked by heavy snow.
"I first have to pour hot water into the tube to melt the snow, but of course I've then got to remember to subtract what I've just put in or I won't get the right precipitation amount!"
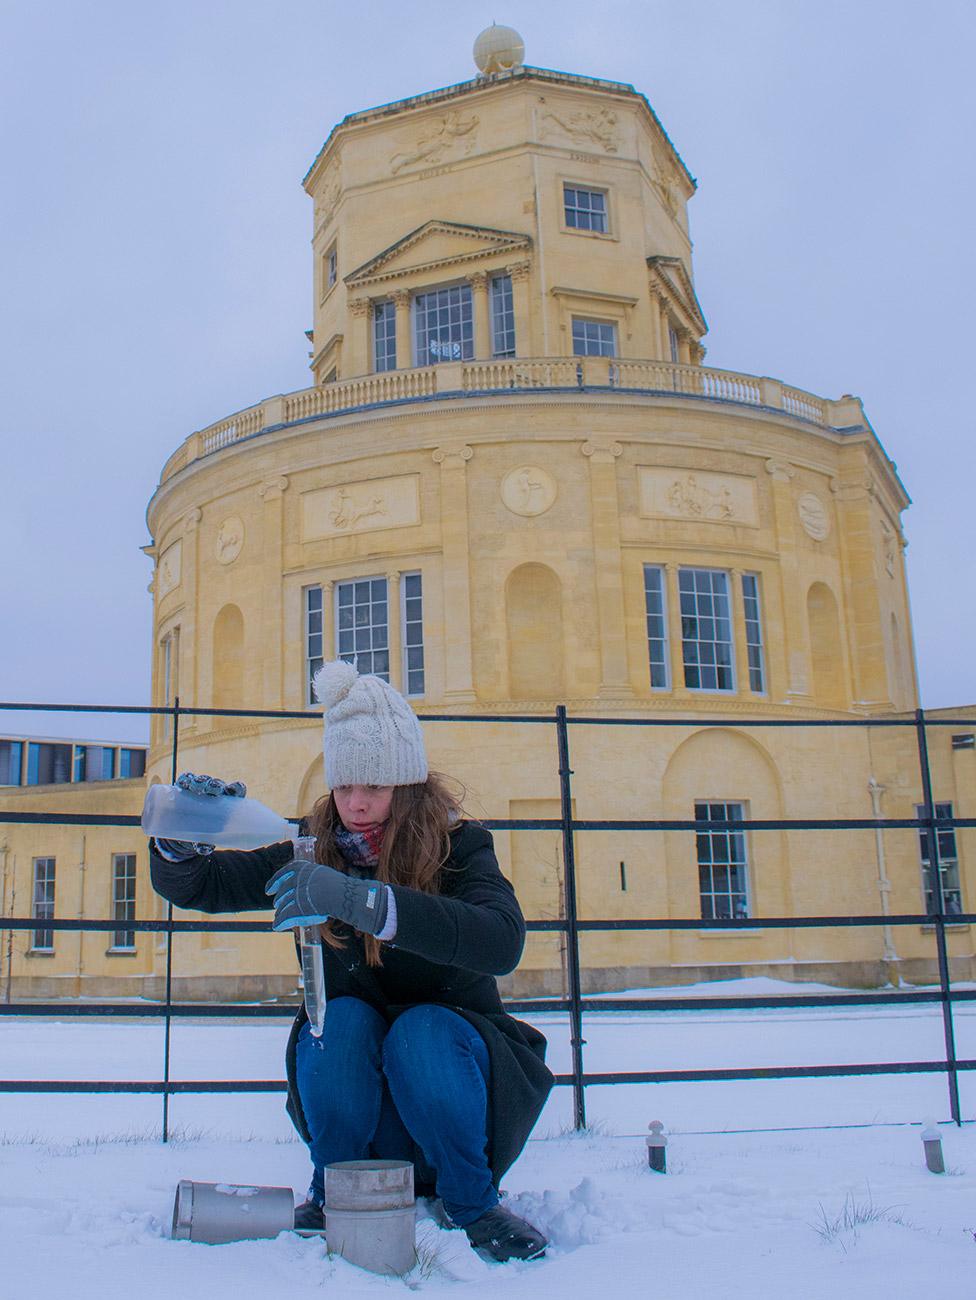
A snowy day in Oxford: Emma Howard feels the weight of history on her shoulders

Serious astronomy ended at the observatory in the 1930s and the weather observations could have been curtailed at that point.
Fortunately, some farsighted people sought to protect and guarantee what's become known as the Radcliffe Meteorological Station (RMS). And its full history has now been detailed in a new book, Oxford Weather and Climate since 1767, authored by Stephen Burt and Tim Burt (no relation).
The pair have carefully corralled all available documentation, even unearthing some previously lost measurements.
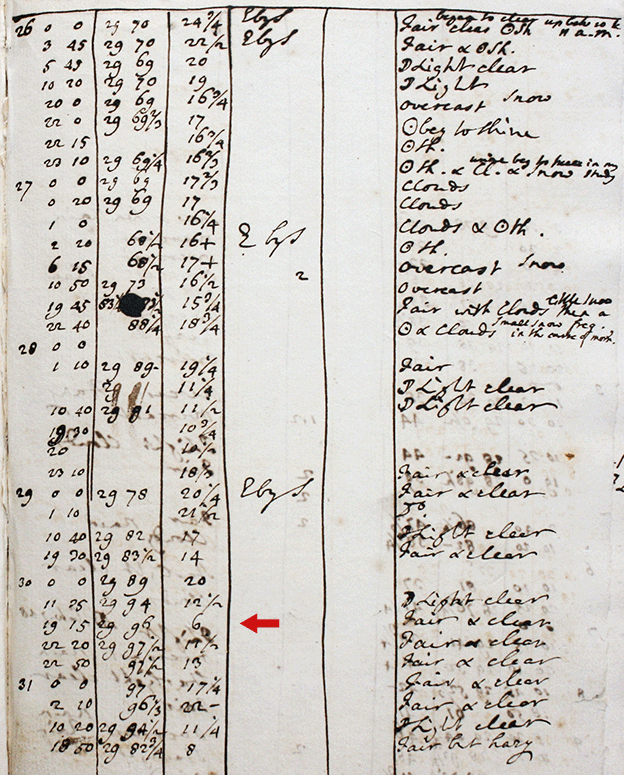
Hornsby said it got so cold on the evening of 30 January 1776 (6F; -14.4C) that his wine froze

They've also made sure the entire data-set is available in a digital format.
"The Radcliffe is really important because it's a record for a single place; it hasn't moved," says Stephen Burt, a visiting fellow to the University of Reading's meteorology department.
"And that means we know exactly what the temperature and rainfall and pressure and sunshine have been doing on that particular spot all this time.
"It's only the long, consistent records built from sound observational practices that can really tell us how our climate is changing," he told BBC News.

Some of the Radcliffe's extreme events
Hottest day (max) - 19 August 1932 & 3 August 1990 - 35.1C
Coldest day (max) - 8 January 1841 - -9.6C
Coldest night (min) - 24 December 1860 - -17.8C
Wettest day - 10 July 1968 - 87.9mm
Longest absolute drought - 19 July-27 August 1976 - 40 days
Greatest snow depth - 13-14 February 1888 - 61cm
Sunniest month - July 1911 - 310.45 hours of sunshine
Dullest month - December 1890 - 5 hours of sunshine

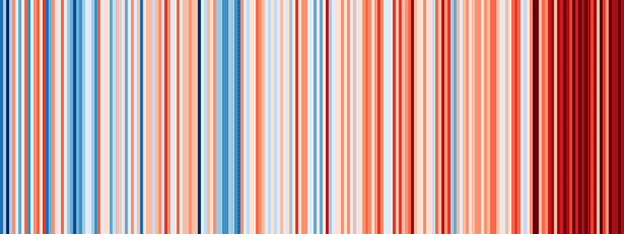
Oxford's "climate stripe" illustrates the unmistakable warming trend (1814-2018)
Go back to the 1850s and annual average temperatures in Oxford would have been around 9.5C-10C. Today, the annual averages are now about 10.5C-11C.
This uptick is captured visually in the Oxford "Climate Stripe", which represents each year's temperature with a coloured line, going from deep blue (coldest) to deep red (hottest).
The change in Oxford temperatures is 1.6 times larger than the change in global temperatures; the city gets a heat boost from being an urban environment and from being reasonably close to continental Europe. But even so, if you overlay the records, the same upward trend is undeniable.
"The red line - the global picture - looks like a smoothed version of the Oxford data," observed Prof Ed Hawkins from Reading University.
"We live on a single planet but we see the fingerprints of global warming at the local scale as well."
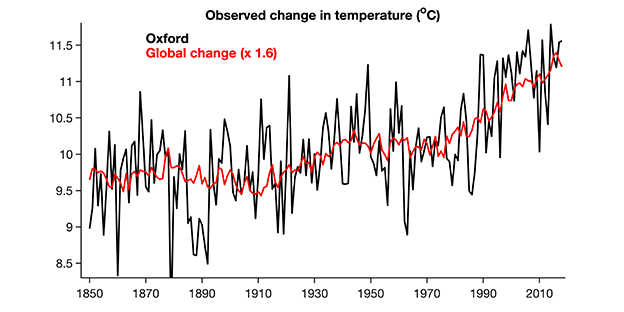
It's perhaps surprising in the era of automation that someone still turns up at 09:00 every day to open the Radcliffe's Stevenson instrument shelter and read off the thermometers.
The rationale is partly down to tradition (and mandated by university decree!) but for the students who do it, it probably also emphasises the importance of process and gives a very meaningful connection to the data.
"These things need to be continued. They are the ultimate anchor to those climate models," said Prof Tim Burt, a former director of the RMS.
"I'm a great believer in the computer models but you also need the long-term data so that you can hind-cast - to run the models backwards in time to show you can reproduce the past before then rolling them forward to see what might happen in the future."
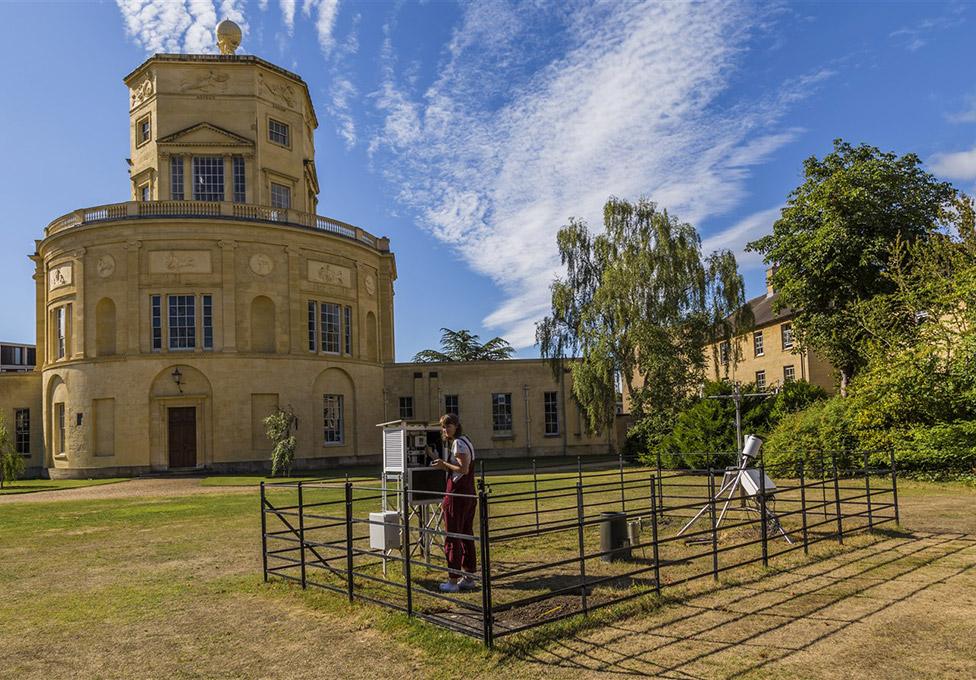
The observers must be on station at 09:00 GMT every day, all through the year

