How British is Britain?
- Published
- comments

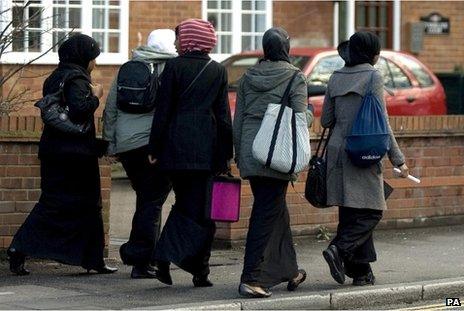
Pupils in Harrow, where people are most likely to describe themselves as British
The British identity is more attractive to younger people than the elderly, according to analysis of data from the 2011 census, writes Mark Easton for The Editors, a programme which sets out to ask challenging questions.
In England and Wales, the generation least likely to have ticked the box marked "British" to describe their national identity are those who lived through the war and watched the sun set on the British Empire.
More than 20% of people under 60 picked British as their sole identity. Among the over-75s, it was just 13%. Suggestions that the British identity is gradually dying out are contradicted by the statistics.
The analysis also reveals that those whose ethnicity is white British are the least likely to describe their identity as British - just 14%. About half of people with black or Asian ethnicity picked British.
The British identity reflects the increasing diversity of our society.
It is a similar story with religion - the faith group least likely to describe themselves as British are Christians (15%) and the most likely are Sikhs (62%).
How British is Britain?
% who identify themselves as just British

London in detail
| Under 10% | |
| 10-15% | |
| 16-20% | |
| 21-25% | |
| 26-30% | |
| Over 30% |
| British identity top five (%) | |
|---|---|
| Harrow | 41.6 |
| Tower Hamlets | 40.6 |
| Brent | 40.5 |
| Redbridge | 39.7 |
| Newham | 39.4 |
A heat map of places according to the proportion of people who just ticked British as their identity in the census reveals London as a hot-spot. The top five local authorities for British identity are all in the capital, with Harrow at number one.
Winston Churchill may have attended the famous public school, but it is Harrow's ethnically diverse population that explains the borough's powerful sense of Britishness.
Outside London, the most British local authorities are Slough, Leicester, Luton and Birmingham - all places with high levels of ethnic diversity.
A question of national identity
% who identify as just English, Scottish or Welsh

London in detail
- England
- Scotland
- Wales
| Under 40% | |||
| 40-49% | |||
| 50%-59% | |||
| 60-69% | |||
| Over 70% |
Top five (%)
| English identity | |
|---|---|
| Castle Point | 77.5 |
| Knowsley | 77.0 |
| Ashfield | 76.1 |
| Cannock Chase | 76.0 |
| Hartlepool | 75.8 |
| Welsh identity | |
|---|---|
| Rhondda Cynon Taf | 73.3 |
| Merthyr Tydfil | 73.2 |
| Blaenau Gwent | 72.4 |
| Neath Port Talbot | 71.8 |
| Caerphilly | 71.2 |
| Scottish identity | |
|---|---|
| W Dunbartonshire | 72.0 |
| N Lanarkshire | 71.6 |
| East Ayrshire | 70.6 |
| Inverclyde | 69.9 |
| Eilean Siar | 69.2 |
The census in 2011 was the first to ask people to describe their national identity and so no comparisons can be made over time. However, it appears that people of working age are significantly more likely to pick British than those of pensionable age.
In Wales, though, children and young people are less likely to describe themselves as British than their parents - about 16% compared to 18%. One possible explanation for this may be the introduction of compulsory Welsh language teaching in schools.
No age breakdown for national identity is yet available for Scotland.
And, as yet, there are no figures from Northern Ireland.
Britishness is attractive to those with a mixed cultural heritage. It has always been an accommodating label, tolerant of complexity and difference. It may be that our increasingly mobile and cosmopolitan society sees the British identity become more popular than it has been in its 300-year history.
Home editor Mark Easton uncovers why defining whether you are British or something else is so important
Heat maps also identify the areas where local people have the strongest sense of English, Scottish or Welsh identity.
In England, the local authorities in which higher proportions of people simply ticked English as their national identity tend to be on the coasts, particularly on the eastern side of the country.
East Anglia and the Fens, parts of the Midlands and up the north-east coast show some of the highest figures for English identity.
The place that tops the table for English identity is Castle Point - the local authority that includes Canvey Island on the Thames estuary. Home to an older and predominantly white, working-class population, eight out of 10 people here ticked the English box in the census.

Scottish only, or Scottish and British?
In Wales, the strongest measure of Welsh-only identity is found in the valleys in the south of the country. Highest of all is the Rhondda area, followed by Merthyr Tydfil and Blaenau Gwent. Younger people are more likely to describe themselves as Welsh than their parents - almost 62% of under 24s compared to 55% of those aged 25-64.
Figures for Scotland, released last week, reveal that the Scottish-only identity is strongest in the central belt. More than 70% of people describe themselves that way in West Dunbartonshire, North Lanarkshire and East Ayrshire.
Overall in Scotland, 62% of people chose Scottish as their sole identity with 8% choosing British only and a further 18% ticking both.
What emerges from the census results is that, while a majority of people in England, Scotland and Wales pick English (60%), Scottish (62%) or Welsh (58%) as their sole identity, younger and more diverse communities show higher proportions selecting a British identity.
Britishness, it would appear, is an identity quite at home in the 21st Century.
BBC News: The Editors features the BBC's on-air specialists asking questions which reveal deeper truths about their areas of expertise. Watch it on BBC One on Monday 30 September at 23.20 BST or catch it later on iPlayer or on BBC World News.
- Published25 June 2013