UK population increases by 500,000, official figures show
- Published
Population growth
As of June 2014 there were
64,596,800
People living in the UK
491,100
more than the previous year
-
259,700 added from net migration
-
226,200 from natural growth
-
25% of all births in 2013 were to mothers born outside the UK
The UK population grew by almost half a million last year to 64,596,800, according to figures from the Office for National Statistics, external.
The "above average" increase of 491,100 from mid-2013 to mid-2014 included net migration adding 259,700 to population growth, the ONS figures show.
This was more than "natural growth" - births minus deaths - which added 226,200.
The ONS said a quarter of births were to mothers born outside the UK.
The overall number of births was down compared with the previous year, continuing a downward trend seen since a peak in mid-2012.

Analysis: Brian Wheeler, BBC Politics
Is there any limit to the size of Britain's population? And if so what is it?
Prime ministers, from Tony Blair to David Cameron, have always refused to answer that question.
To do so would risk accusations of pandering to the far-right and provide a hostage to fortune, when their predictions, inevitably, proved wide of the mark.
UKIP leader Nigel Farage has made political capital out of their discomfort but even he rarely talks about the overall size of the population.
David Cameron thought he had hit on a formula for talking about numbers without announcing that the country is full by targeting "net migration".
But, his critics would say, he only succeeded in revealing how little control he has over it.
For some Britain's growth spurt, which began at the end of the 1990s, is a sign of success. It is the secret weapon that will pay the pensions bill and underpin economic growth. Some of our European neighbours struggling with declining populations, such as Germany, can only look on in envy.
But anxiety about the pressure on services and the pace of cultural change among many voters is not likely to go away.

The population increase was above average compared with rises over the last decade, the ONS said.
As well as net migration and natural growth, other changes and adjustments, mainly in the armed forces, accounted for an increase of 5,200 people, the ONS said.
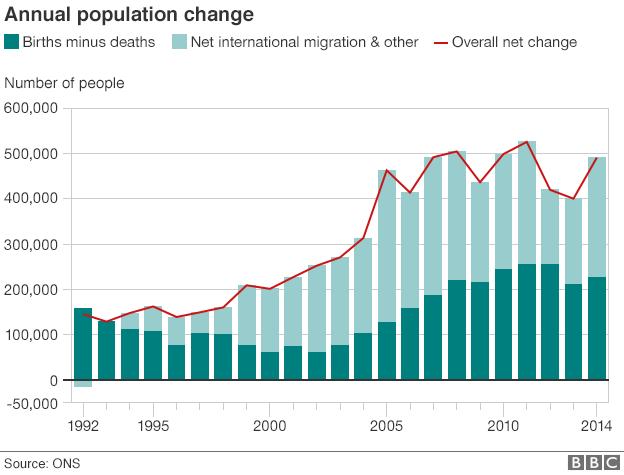
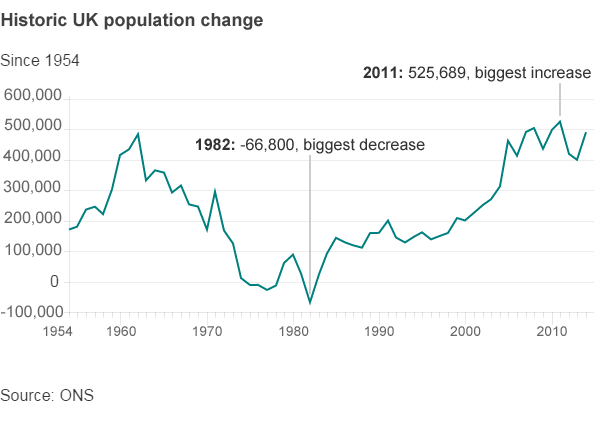
The ONS figures show the annual growth in population rose steadily from about 150,000 in 1992 to about 300,000 in 2004, but that rose sharply in 2005 to 460,000.
It has remained above 400,000 since - 2014's net increase is the fifth biggest.
Migration Watch, which supports tighter immigration controls, said the increase "will only worsen the housing crisis and put still more pressure on our public services."
Population Matters, which researches the environmental impact of population size, said the growth is having an impact on quality of life.
"We are all affected adversely by the rapid population growth of recent decades," said chief executive Simon Ross. "Examples include pressure on housing and public services to the environment and climate change."
Ageing population
The figures also found that the number and proportion of older people in the UK continued to rise.
The median age of the population - the age at which half the population is younger and half the population is older - in mid-2014 was 40 years, the highest ever estimated.
There were 11.4 million people (17.7% of the population) aged 65 and over in mid-2014, up from 11.1 million (17.4%) in the previous year.
Of the UK's individual nations, England's population grew the most quickly during the year, growing by 450,800 people (0.84%).
Within England, London had the highest population growth, up 1.45%. The East and South East regions of England increased by 1.08% and 0.92% respectively.
Net migration accounted for 53% of the overall population increase
Regional increases
The figures found that the population of Scotland increased by 19,900 (up 0.37%) to 5,347,600 and accounts for 8% of the UK's population.
Meanwhile Wales' population increased by 9,600 (up 0.31%) to 3,092,000 and accounts for 5% of the UK's population
Northern Ireland's population, which accounts for 3% of the UK's population, increased by 10,800 (up 0.59%) to 1,840,500 people/
The lowest regional population increases in the year were seen in Wales, North East of England and Scotland growing by 0.31%, 0.32% and 0.37% respectively.
No country of the UK or region of England experienced a population decrease.

Biggest population increases in the UK by local authority
1. City of London - up 5.54% from 7,600 to 8,100
2. Tower Hamlets, London - up 4.08% from 272,900 to 284,000
3. Westminster, London - up 2.84% from 226,800 to 233,300
4. Forest Heath, West Suffolk - up 2.56% from 61,200 to 62,800
5. Islington, London - up 2.48% from 215,700 to 221,000
6. Coventry - up 2.31% from 329,800 to 337,400
7. Hackney, London - up 2.24% from 257,400 to 263,200
8. Camden, London - up 2.23% from 229,700 to 234,800
9. Oxford - up 2.08% from 154,800 to 158,000
10. Exeter - up 2.08% from 121,800 to 124,300
Source: ONS, figures for mid-2013 to mid-2014

- Published25 June 2015

- Published6 March 2015
- Published26 June 2014
- Published29 September 2013
