Where are the UK's youngest and oldest city populations?
- Published

Cities are often thought of as places for the young, but the reality is that many have an ageing population. What difference does the age of a city's residents make?
Over the past two decades, the average age of a UK resident has risen by two years, to 40. Within 30 years, one in four people is expected to be aged 65 and over, external.
But the picture in cities is more complex.
At 38, the average city dweller is younger. Cities are home to 62% of people aged 18-34, but only 46% of those aged 65 and over.
Despite this, the populations of most UK cities are growing older, raising big questions about what that means for their development, and for meeting the future needs of residents.
The Centre for Cities looks at built-up urban areas with 135,000 or more people, external, rather than just officially recognised cities. This allows us to compare changes across the UK's largest centres of population.
The UK's youngest cities
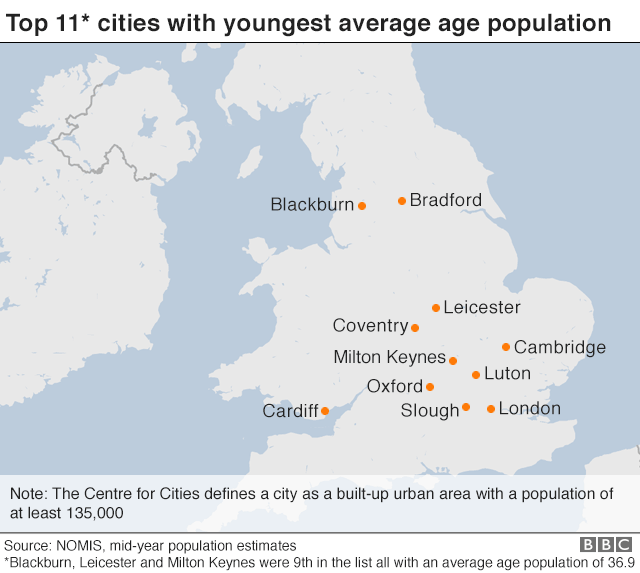
The UK city with the youngest population is Slough, with an average age of 33.9 and only one in 10 people aged 65 and over.
It is followed by Oxford (34.4) and Luton (35.1). The average age in London, the sixth youngest city, is 36.5.

Slough and Luton have particularly high shares of under-18s, partly because they have the highest birth rates of all UK cities - 16.6 and 17.9 births for every 1,000 residents, compared to the British average of 11.8. This has been partly driven by their young migrant populations.
Oxford has the highest share of people aged 18-24, reflecting the city's large university population.
The UK's oldest cities
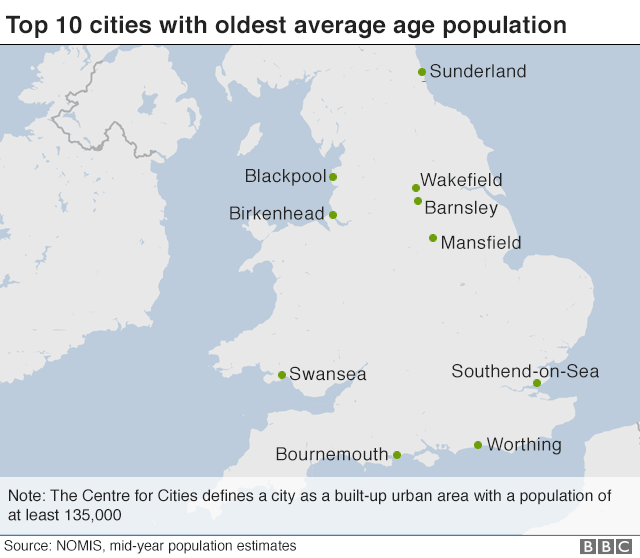
In contrast, Blackpool has the oldest population of any UK city, with an average age of 43.2.
It is followed by fellow coastal cities of Worthing (43), Bournemouth (42.8) and Southend (42.2).

These cities have high shares of people who are at retirement age.
More than one in five residents of each city was 65 and over in 2016 - apparently reflecting the pull of the seaside for people who have finished their working lives.
Change over the past 20 years
Over the past 20 years, younger people have increasingly chosen to live in urban areas, while the share of older residents in cities has fallen.
In 1996, 58% of people aged 18-34 lived in cities, but this had risen to 62% by 2016.
In contrast, the share of people aged 65 or older in cities fell from 51% to 46% during this period.
Despite these patterns, the average age of the population in most cities has changed in line with that of the population of the UK as a whole.
Only six cities - Brighton, Exeter, Oxford, Cambridge, Coventry and Slough - saw a drop in the average age of their population, mostly as a result of expanding student populations and Slough's high birth rate.

The populations of most cities grew older.
Sunderland's population aged most, with the average resident being just under four years older (41) in 2016 than in 1996. It is closely followed by the urban areas around Aldershot, Warrington and Middlesbrough.
There are two main groups among the cities which age faster than others.
The first is made up of those which have struggled economically in recent decades - for example, Middlesbrough and Wigan.
They have seen a decline in people aged between 25 and 40 - most probably because of young people moving away in search of job opportunities.
The second group is made up of new towns such as Milton Keynes and Warrington.
It was mostly young people who moved to new towns in the decades after they were created.
However, those once-young residents have got older - and the average age of these cities has increased.
Milton Keynes, for example, had a large population of 20 and 30-somethings in 1996, but they are now approaching middle age.
What does this mean for cities?
A younger population can bring advantages such as attracting businesses, who will have a larger pool of working age residents to draw from.
However, cities need to provide opportunities for young people to start and build careers, as well as cultural amenities, schools and affordable housing.
Among those cities which have been getting younger, Oxford, Cambridge and Brighton have large shares of high-skilled, high-paying jobs, and all offer good access to quality schools.
But housing is an issue in these cities, which are among the least affordable places in the UK.

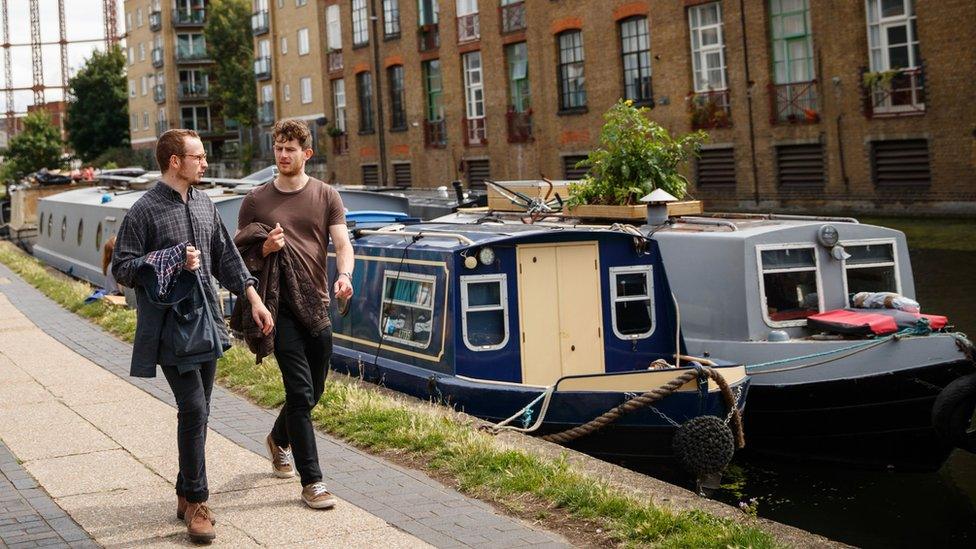
London is one of the UK's youngest cities - with an average age of 36.5
Cities with older populations have different benefits and challenges.
Older people of working age tend to be more productive and can command higher wages because of their experience and skills.
This in turn increases disposable income which can be spent in shops, bars and restaurants.
But it's also clear that places which have older residents face greater demands in terms of health and social care provision.
Another challenge, which faces all cities, is that they do not have great flexibility over how they spend money.
For example, much of the money that cities receive from central government is allocated for specific issues - like potholes and schools.
It could be that some would benefit from being able to prioritise social care, or affordable family homes, for example.
As their populations continue to diverge, cities are likely to become increasingly focused on the needs of their own residents.
It is clear that some will be growing old faster than others.
Youngest and oldest cities
Slough 33.9
Oxford 34.4
Luton 35.1
Cambridge 35.4
Coventry 36.2
London 36.5
Bradford 36.7
Cardiff 36.7
Blackburn 36.9
Leicester 36.9
Milton Keynes 37
Peterborough 37
Crawley 37.2
Northampton 37.5
Birmingham 37.6
Hull 37.6
Leeds 37.6
Southampton 37.6
Bristol 37.7
Exeter 37.7
Manchester 37.8
Reading 37.8
Derby 38
Belfast 38.1
Chatham 38.2
Liverpool 38.2
Nottingham 38.2
Brighton 38.5
Ipswich 38.6
Edinburgh 38.7
Gloucester 38.8
Aberdeen 38.9
Sheffield38.9
Swindon38.9
Telford 39
Huddersfield 39.1
Basildon39.3
Plymouth 39.4
Aldershot 39.5
Glasgow39.5
Burnley 39.6
Dundee 39.6
Stoke 39.6
York 39.6
Newcastle 39.8
Preston 39.9
Middlesbrough 40
Newport 40
Portsmouth 40.3
Warrington 40.4
Doncaster 40.5
Wigan 40.6
Norwich 40.7
Mansfield 40.8
Wakefield 40.8
Barnsley 40.9
Sunderland 41
Swansea 41
Birkenhead 42.1
Southend 42.2
Bournemouth 42.8
Worthing 43
Blackpool 43.2
Source: NOMIS, mid-year population estimates

About this piece
This analysis piece was commissioned by the BBC from an expert working for an outside organisation.
Andrew Carter is Chief Executive and Paul Swinney is Head of Research and Policy at the Centre for Cities, which describes itself as working to understand how and why economic growth and change takes place, external in the UK's cities.

Edited by Duncan Walker