Scottish council elections 2017: How things stand and how they might change
- Published
Scotland is gearing up for another election campaign, this time for local councils. How do things stand in the country's town halls, and how are they likely to change in May?

Last time out
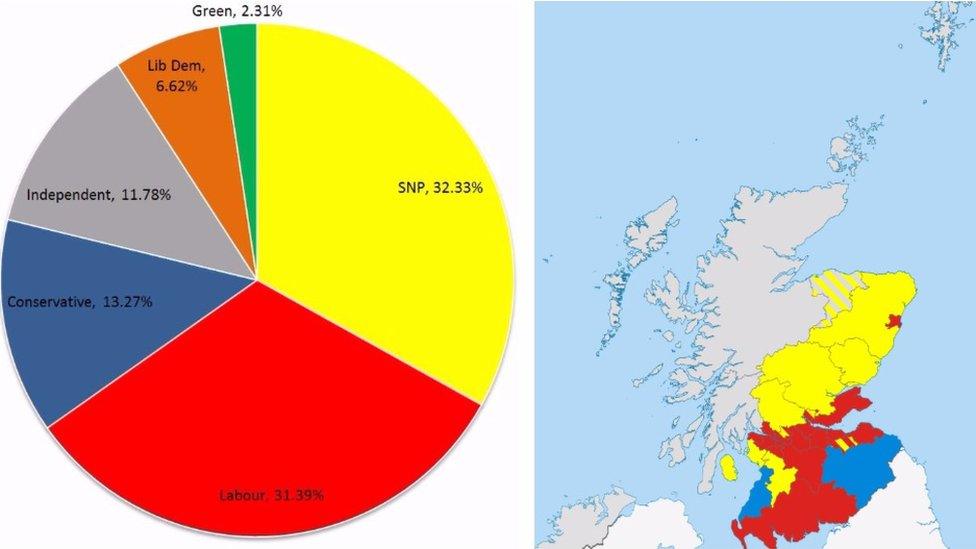
The percentage of first-preference votes won in 2012 (left), and the party with the most seats by council area (right)
The swingometer is likely to have a wild night on May 4, primarily because the 2012 election bucked recent trends.
Despite the SNP having settled into an unprecedented majority position at Holyrood the previous year (2011), the party only narrowly beat Labour in the local authority vote.
The Nationalists took 32% of first-preference votes and 425 seats to Labour's 31% and 394 seats, with the Tories trailing on 13% (115 seats) and the Lib Dems on 6% (71 seats). Independent candidates actually outdid the Tories and Lib Dems (then in coalition together at Westminster) put together, taking 196 seats.
Fast-forward to 2016's Holyrood elections, and the SNP was up on 46.5% of the constituency vote, with the Tories and Labour on 22% - a rather different picture.
And perhaps more crucially given the constitutional divide showing up in the electorate, many areas where Labour did well in 2012 have since become clear Yes-voting areas - of the five councils which Labour runs as a majority, three of them backed independence in 2014.
Take Glasgow City Council (as the SNP hope to). Last time out Labour returned to power by taking 44 seats to the SNP's 27. But the city voted Yes in 2014 and the electoral map subsequently turned yellow, with the SNP taking every single constituency seat in both the 2015 Westminster and 2016 Holyrood elections.

Controlling councils
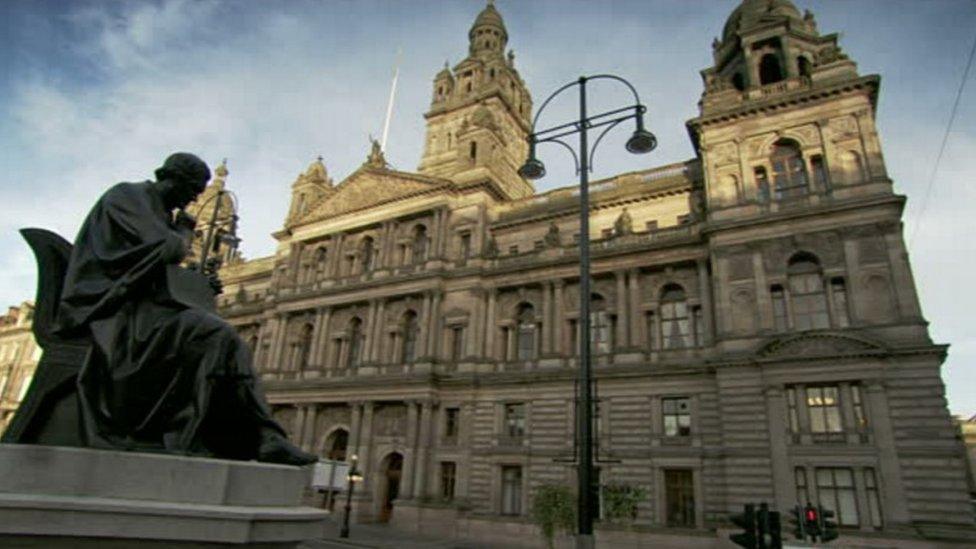
Labour retained control of Glasgow City Council in 2012 but face a stiff challenge in the city from the SNP in 2017
What added intrigue to the 2012 result was what happened after the votes were counted; despite being pipped by the SNP in the overall vote, Labour still found itself calling the shots in far more town halls than their rivals.
Labour is currently either in charge of, external or propping up 19 of Scotland's 32 council administrations - almost double the number the SNP help run, at ten.
There is a dizzying rainbow of coalitions across the country; SNP-Conservative, Labour-Conservative, SNP-Labour, SNP-Lib Dem, and a whole host of areas where independent councillors either support party administrations, or occasionally band together to run the whole show themselves.
Does the comparatively poor representation for the SNP on administrations despite their share of the vote reflect the unwillingness of other, chiefly unionist, parties to do a deal with them - or indeed their willingness to gang up on them?
Some by-election results have certainly shown unionist voters taking an "anyone but the SNP" approach. And that is unlikely to go away in May - although a big increase in the number of SNP councillors would make it all but impossible for other parties to shut them out.

Counting the votes
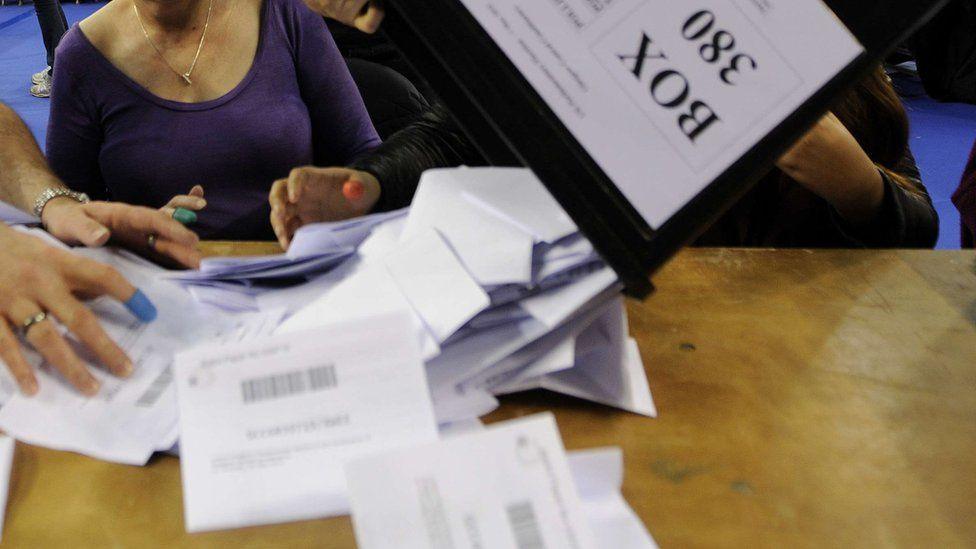
Scottish council elections use the "single transferable vote" system
To keep things interesting, each of Scotland's elections uses a different electoral system.
Westminster polls use the winner-takes-all first past the post (FPTP) system; Holyrood uses the additional member system (AMS); and councils use the single transferrable vote (STV), a form of proportional representation.
In the privacy of the ballot box, voters rank as many of the candidates as they like in order of preference.
Wards select multiple representatives - usually three or four - so voters effectively get the chance to pick all of the candidates they'd like to represent them, in order of preference. It also gives them a chance to back extra candidates in reserve, in case their favourite does not make the cut.
There is a fuller explanation here, but basically the system redistributes second-preference votes after candidates are elected or eliminated, with multiple rounds of counting continuing until candidates hit a predetermined quota.
It might sound terrifically complicated, but backers of the system argue it produces a fairer result, reflecting the preferences of the electorate.

Picking preferences
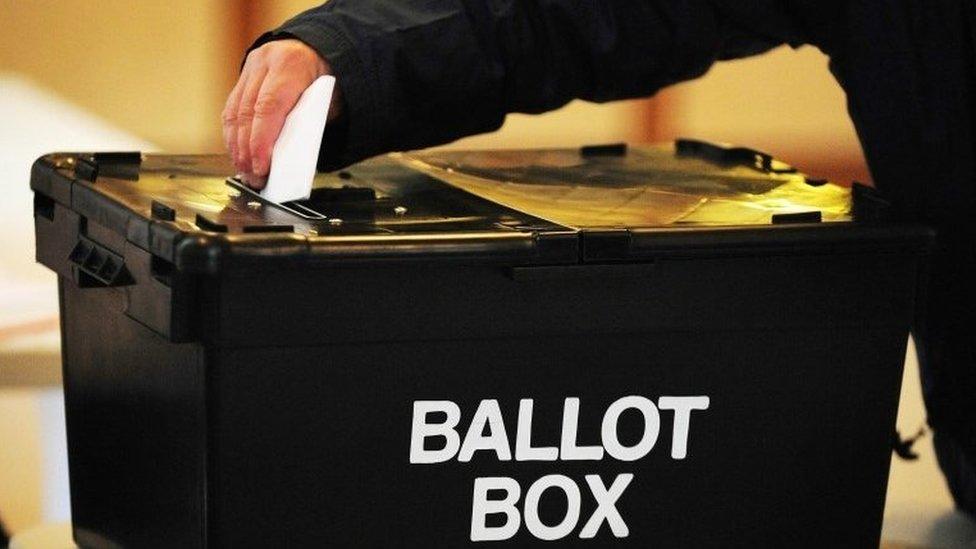
Where will party loyalists send their second preference votes?
STV is designed to make sure that those elected enjoy the broadest possible support from the electorate - the opposite of the first past the post system, where very often candidates can be elected with backing from less than half of those who voted.
But how do people go about selecting their second (or third) choices?
In 2012, some 44% of SNP voters didn't bother with a second preference - but most of those who did plumped for Labour or the Lib Dems. Labour voters meanwhile were even less likely to hand out a second preference - 47.8% didn't - but those who did mostly backed the SNP or the Lib Dems.
Tories mostly supported their coalition chums of the time, the Lib Dems; on average they got 32% of Tory second-preferences, compared to 8.3% for the SNP and 8% for Labour. The Lib Dems returned the love, with 21.8% of their second-preferences going to the Tories, compared with 20.4% for Labour and 15.5% for the SNP.
Green voters meanwhile split their second-preferences fairly evenly between the Lib Dems, Labour and SNP (in that order).
That's all very well, but some things have happened since 2012. A couple of referendums, to start with.
Some recent by-elections have seen SNP candidates start out in front, before seeing that lead gradually eroded as what appears to be unionist votes wash between Labour, the Lib Dems and the Tories.
In one by-election in Inverness in October 2016, the battle for a single seat came down to eight rounds of counting, with the Lib Dems pipping the SNP at the post after votes from the third-placed Conservative candidate were redistributed.
The SNP held the lead for seven rounds of counting, but the Lib Dems overhauled her by just 25 votes, external in the final round, external.
The redistributed Tory votes fell far more in favour of the Lib Dems than the SNP (233 to 31) - could that be a pattern we'll see more of in May?

Alphabetti Spaghetti
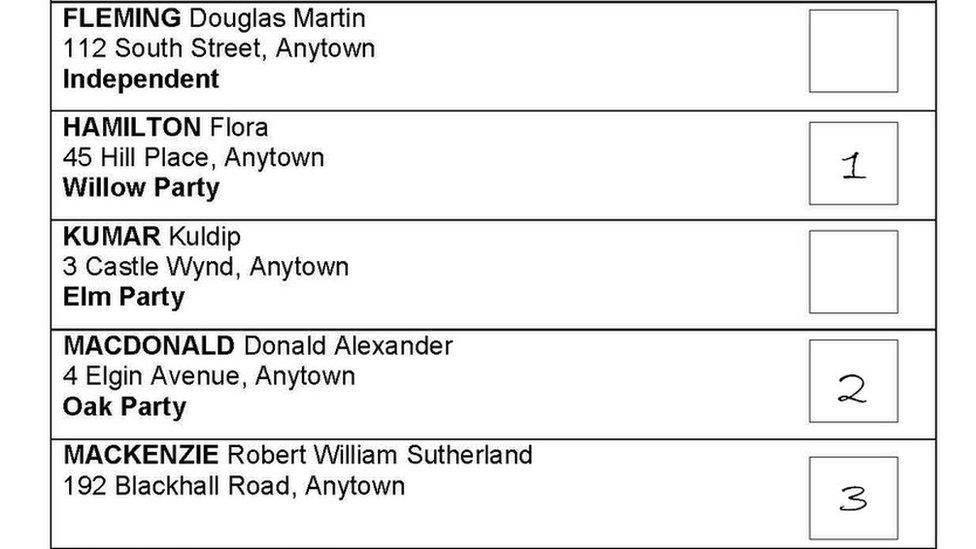
Candidates are listed on ballot papers in alphabetical order
In multi-member wards the layout of the ballot paper in the STV system, which lists candidates alphabetically, can have an interesting knock-on effect.
Many people vote along party-political lines. And because candidates are listed alphabetically, where two from the same party run in the same ward, they usually end up being ranked in that same alphabetical order by voters.
Basically, voters often end up giving their first preference vote to the first candidate they spot from their party of choice, and their second preference to the next one.
One study suggested, external that of the 327 cases where parties put forward two candidates in a single ward in the 2007 elections, candidates were returned in alphabetical order in 274 of them. The trend was bucked in just 16% of cases. It was claimed that the odds of this happening purely by chance were "less than one in one million billion billion billion".
A motion, external was tabled at Holyrood calling for a change to alphabetical ordering that year, after six senior Edinburgh councillors claimed they had lost their seats to more junior party colleagues who appeared above them on the ballot paper by dint of their surnames.
MSP Kenneth Gibson continues to raise the issue a decade later - at the local government committee in January 2017 he said alphabetical ordering was disadvantaging candidates in 92% of wards where two or more people from the same party stand.
He said: "Surely it is time to randomise surnames - as the SNP does in its internal elections - so that there is no advantage to Alasdair Allan if he were to stand against Andy Wightman, for example."

The Brexit/indyref2 dimension
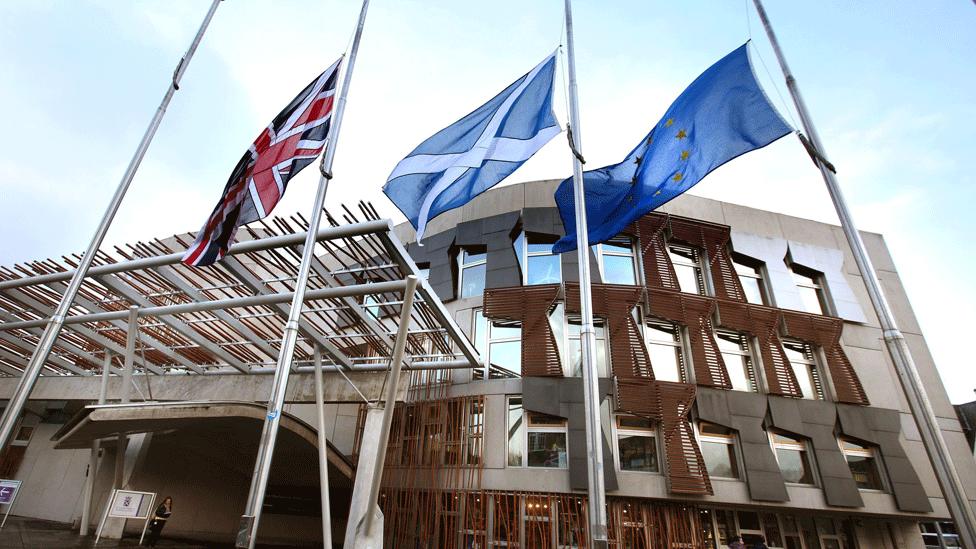
Indyref2 could potentially leave Scots choosing between the EU and the UK
Scots have got quite used to elections being dominated by constitutional matters of late.
As much as local elections should focus on local issues, with the UK in the process of leaving the EU and the SNP pushing for a new independence referendum it's hard to see such national issues not coming up on the doorsteps.
The Remain/Leave divide adds a new dimension to the existing Yes/No schism. But will the referendum of 2016 have a similar knock-on effect to the aftermath of the 2014 vote, as we saw above in Glasgow?
It's true that 62% of voters backed Remain in Scotland - the side that every one of Holyrood's parties officially endorsed.
But there were still a million Leave votes cast across the country - not insignificant when you consider that only 1.5 million people voted at all in the last Scottish council elections.
Recently unearthed ward-level data has shown some Leave strongholds in Scotland - a cluster of wards in the Banff and Buchan area had a Brexit majority of 61%. This can also be seen in fishing communities in the Western Isles and in Shetland - Whalsay and South Unst in Shetland returned a combined 81% vote for Leave.
With competition for Remainer votes fierce, will any of the main parties make a pitch directly towards Leave voters?
In England, the likely home for frustrated Brexiteers would probably be UKIP, but the party has struggled to make any electoral impression in Scotland - its share of 2% of the regional vote in 2016's Holyrood election was only just better than the 1.6% recorded in the previous year's Westminster vote.

Turnout
Turnout in the 2012 council elections was 39.6% - low in comparison with 52.8% in 2007 and 49.6% in 2003 (although those years both coincided with Holyrood elections).
Will turnout rebound in 2017?
It might not help that Scots have just come off a run of five votes inside three years, between two referendums and elections to the European, Westminster and Holyrood parliaments. Voter fatigue could prove an issue - equally among the electorate themselves, and the party activists tasked with hitting the doorsteps and "getting the vote out".
By-election turnout has always been patchy - a few Glasgow City Council votes in 2015 only just scraped into double figures - but the average turnout in by-elections since the start of 2016 has been 28%.
In addition, the amount of importance people think local government has appears to be on the wane.
The latest Scottish Social Attitudes Survey, external found 5% of respondents thought local councils had the most influence over how Scotland is run, behind the Scottish and UK governments on 42% and 41% and the EU on 8%.
While there has been some fluctuation since the annual survey began in 1999, this was the lowest ever figure - down from 10% in 2012 and a high of 20% in 2004, when councils actually ranked above Holyrood.